Developers connecting, extending and building custom GraphQL APIs with Grafbase haven't had any way to track and monitor API, until today.
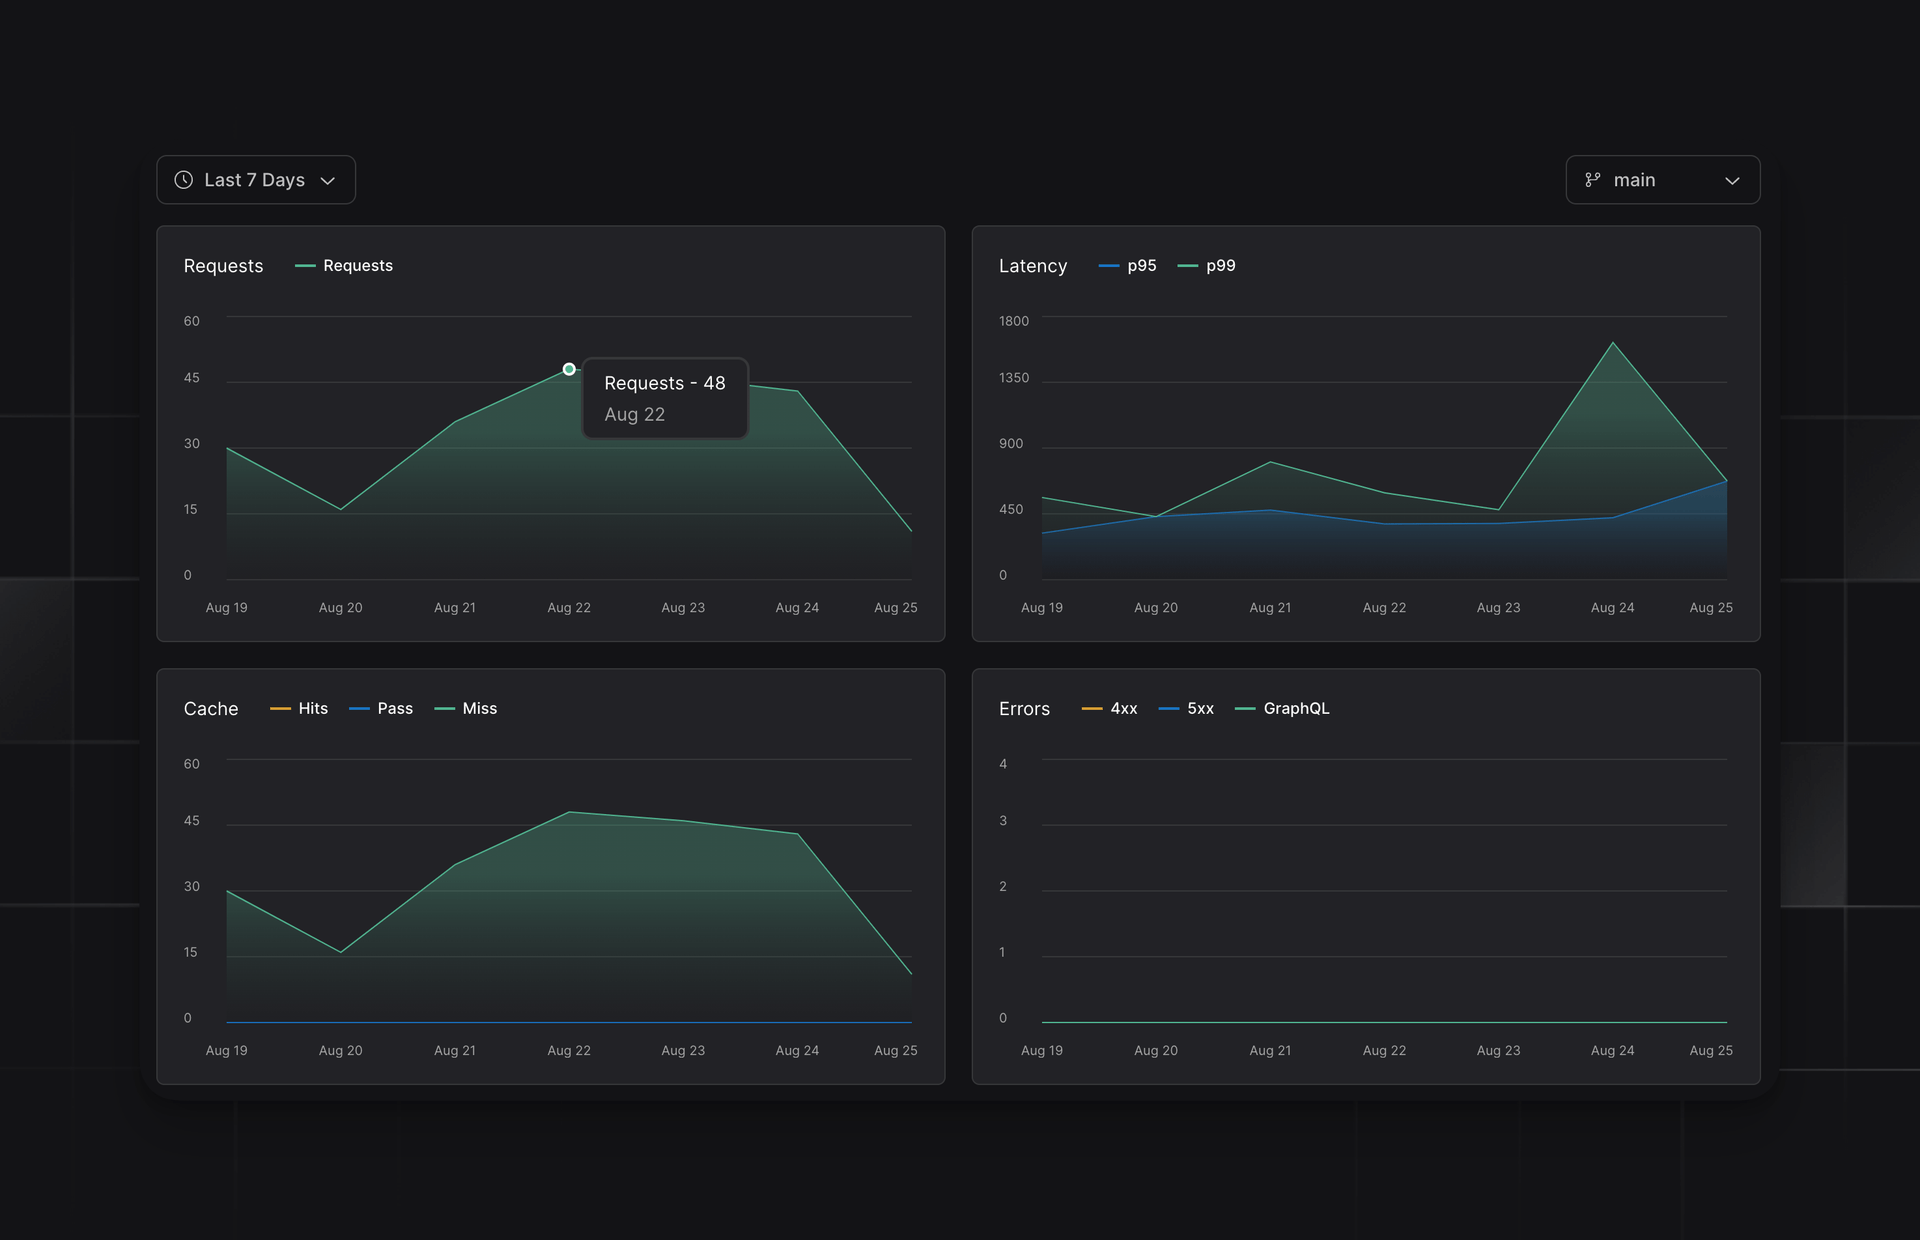
Our new analytics dashboard provides you with a comprehensive view of how your APIs are performing in real-time for:
- Requests
- Latency
- Cache
- Errors
Visualize the number of requests hitting your endpoints, understand the latency of each request, monitor the efficiency of your cache, and swiftly identify and rectify errors. This granularity ensures that you not only deliver optimal user experiences but also iterate on your APIs with data-driven decisions.

Get started and create an account today.
We'd love to hear your feedback and ideas, so join us on Discord.
