For our GraphQL Federation launch last year we built a new GraphQL gateway from scratch in Rust to efficiently plan and execute queries. Recently we started benchmarking the Grafbase Gateway to see how it performs compared to others. Luckily for us The Guild already created a good benchmark setup gateways-benchmark. A sincere thank you to The Guild for creating the benchmarks!
To ensure a fair comparison, all gateways are given the same CPU and RAM resources, limited by Docker. It executes a fairly complex query repeatedly with K6 (load-testing tool) with a constant VUs (virtual users) and a ramping VUs scenarios. The complex query ensures we're actually measuring the performance of the query planning and execution. The final response content is 88KiB big, merged from several subgraph responses.
fragment User on User {
  id
  username
  name
}

fragment Review on Review {
  id
  body
}

fragment Product on Product {
  inStock
  name
  price
  shippingEstimate
  upc
  weight
}

query TestQuery {
  users {
    ...User
    reviews {
      ...Review
      product {
        ...Product
        reviews {
          ...Review
          author {
            ...User
            reviews {
              ...Review
              product {
                ...Product
              }
            }
          }
        }
      }
    }
  }
  topProducts {
    ...Product
    reviews {
      ...Review
      author {
        ...User
        reviews {
          ...Review
          product {
            ...Product
          }
        }
      }
    }
  }
}
We pushed a PR to add Grafbase to the repository. But the current results, at the time of writing, seem to be biased by the lack of CPU of the benchmark machine. We executed and tweaked the benchmarks ourselves. Hereafter we'll explain our benchmarking protocol, and then the results.
gateways-benchmark primarily focuses on throughput: it saturates each gateway with requests from a high number of virtual users. It's a good benchmark to compare raw throughput, but by sending a lot of requests in parallel most gateways end up CPU-bound rather than IO-bound. With the gateway runtime splitting its limited CPU-time between each in flight request, the latency increases for each additional concurrent request.
At Grafbase we place a high importance on latency, so wanted to test how much throughput can be handled while keeping latency low. So the first step was to ensure we only take into account measurements which weren't CPU-bound, but get as close as possible to being so. Secondly, we don't test with a constant number of virtual users, but with a fixed arrival rate of requests. This provides us considerably more control over the measurements.
Our benchmark ran on a Linux (6.7.0) machine with 32 cores (Ryzen 7950X3D) for the following gateways:
- Apollo Router v1.38 with and without traffic shaping.
- Cosmo Router v0.57.0
- Mesh v0.1 with Bun v1.0.26
- Grafbase Gateway v0.59.0
We re-ran the benchmarks with the latest version, at the time of publishing, of Apollo Router (1.40.1) and Cosmo Router (0.69.1) and we didn't see any significant changes in the benchmarks.
To ensure we get the best possible results we:
-
Dedicated a machine to the benchmarks.
-
Used the host network in Docker (network_mode: host)
-
Disabled CPU boost which adjusts the CPU frequency depending on the load:
echo "0" | sudo tee /sys/devices/system/cpu/cpufreq/boost -
Executed a first batch a of warm up requests before the actual benchmark. All gateways have some form of plan caching and most real-world servers usually only respond to a fairly small set of predefined GraphQL queries.
-
Limited each gateway CPU usage with Docker resources.limit.cpus.
The 4 subgraphs from gateways-benchmark are written in Rust with async-graphql, over all benchmark runs they consumed at most the equivalent of 3-4 CPU cores. So their impact should be negligible.
A benchmark run lasts 60 seconds with a fixed arrival rate. We increased the rate, by increments as small as 5 request/s, until the gateway couldn't handle the load on time anymore. We defined that point as when the actual throughput is inferior to the arrival rate by 3 request/s or more. The fixed arrival rate is maintained by K6 with a pool of a virtual users. Most of the time the pool size doesn't matter, except when reaching the limits of the gateway.
If a request took too long K6 would send an additional request with a new virtual user in order to maintain the arrival rate. Sharing the CPU with a few additional requests was sometime the tipping point into being CPU-bound, with requests then taking significantly longer waiting for their turn. This triggers a spiral of K6 sending even more requests in parallel, up to the maximum allowed, which only exacerbates the problem. So we regularly adjusted the limit to be roughly just enough to handle the expected throughput. If at some moment the gateway could not handle it K6 wouldn't be able to send a lot of additional requests. Too low or too high and the actual throughput wouldn't be within the 3 request/s margin.
The K6 configuration is as follows:
import http from "k6/http";
import { check } from "k6";

// Warmup (in another K6 configuration file)
export const options = {
  scenarios: {
    open_model: {
      executor: 'constant-arrival-rate',
      rate: 100,
      timeUnit: '1s',
      duration: '3s',
      preAllocatedVUs: 2,
    },
  },
};

// Actual benchmark
export const options = {
  scenarios: {
    open_model: {
      executor: 'constant-arrival-rate',
      rate: parseInt(__ENV.BENCH_RATE),
      timeUnit: '1s',
      duration: '60s',
      // Also defines the maximum, depending on the case could be as low as 3 or as high as 300
      preAllocatedVUs: 20,
    },
  },
}

const graphqlRequest = {
  payload: JSON.stringify({
    query: '', // The query above
  }),
  params: {
    headers: {
      "Content-Type": "application/json",
    },
  },
};

export default function() {
  const res = http.post(
    __ENV.GATEWAY_ENDPOINT || "http://localhost:4000/graphql",
    graphqlRequest.payload,
    graphqlRequest.params
  );

  // Only checking for 200 responses here, but we did more validation as mentioned after.
  check(res, {
    "response code was 200": (res) => res.status == 200,
  })
}
The original gateways-benchmark does a few additional checks on the response, but they were even more CPU-intensive than the gateways themselves. We noticed that this impacted our results, so we disabled them during the benchmarking. We did keep them in the warmup as a sanity check though. And we did run the benchmarks with similar throughput with the checks enabled, ensuring we do receives correct results. We disabled them for the measures we're showing here.
During the benchmark we simply measured CPU and RAM consumption through docker stats with the following script:
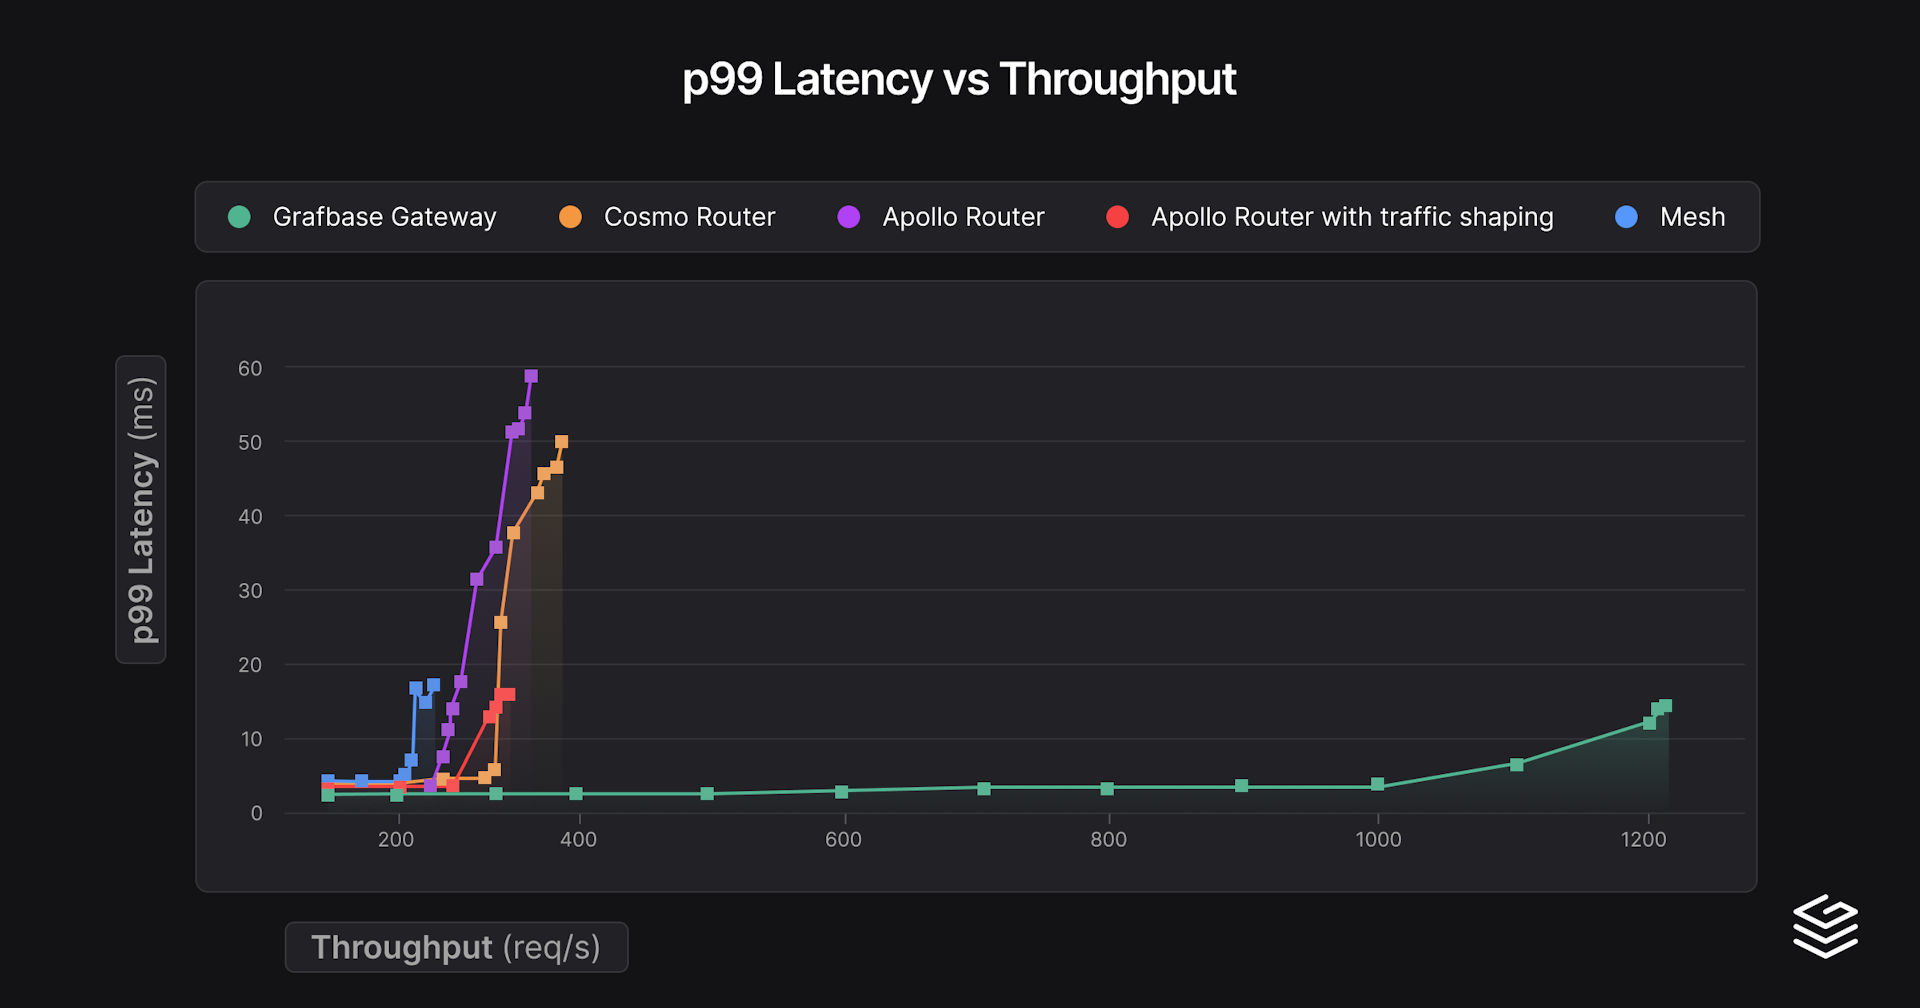
timeout 60 docker stats --format '{{ json . }}' 'gateway' | sed 's/\x1b\[[0-9;]*[a-zA-Z]//g' ; echoThis first series of benchmarks had a single core (limit.cpus: 1) without any artificial network delay to have a baseline. The following graph presents the latency depending on the actual throughput the gateway managed to satisfy.
And here are the peak RAM consumption for those benchmark runs:
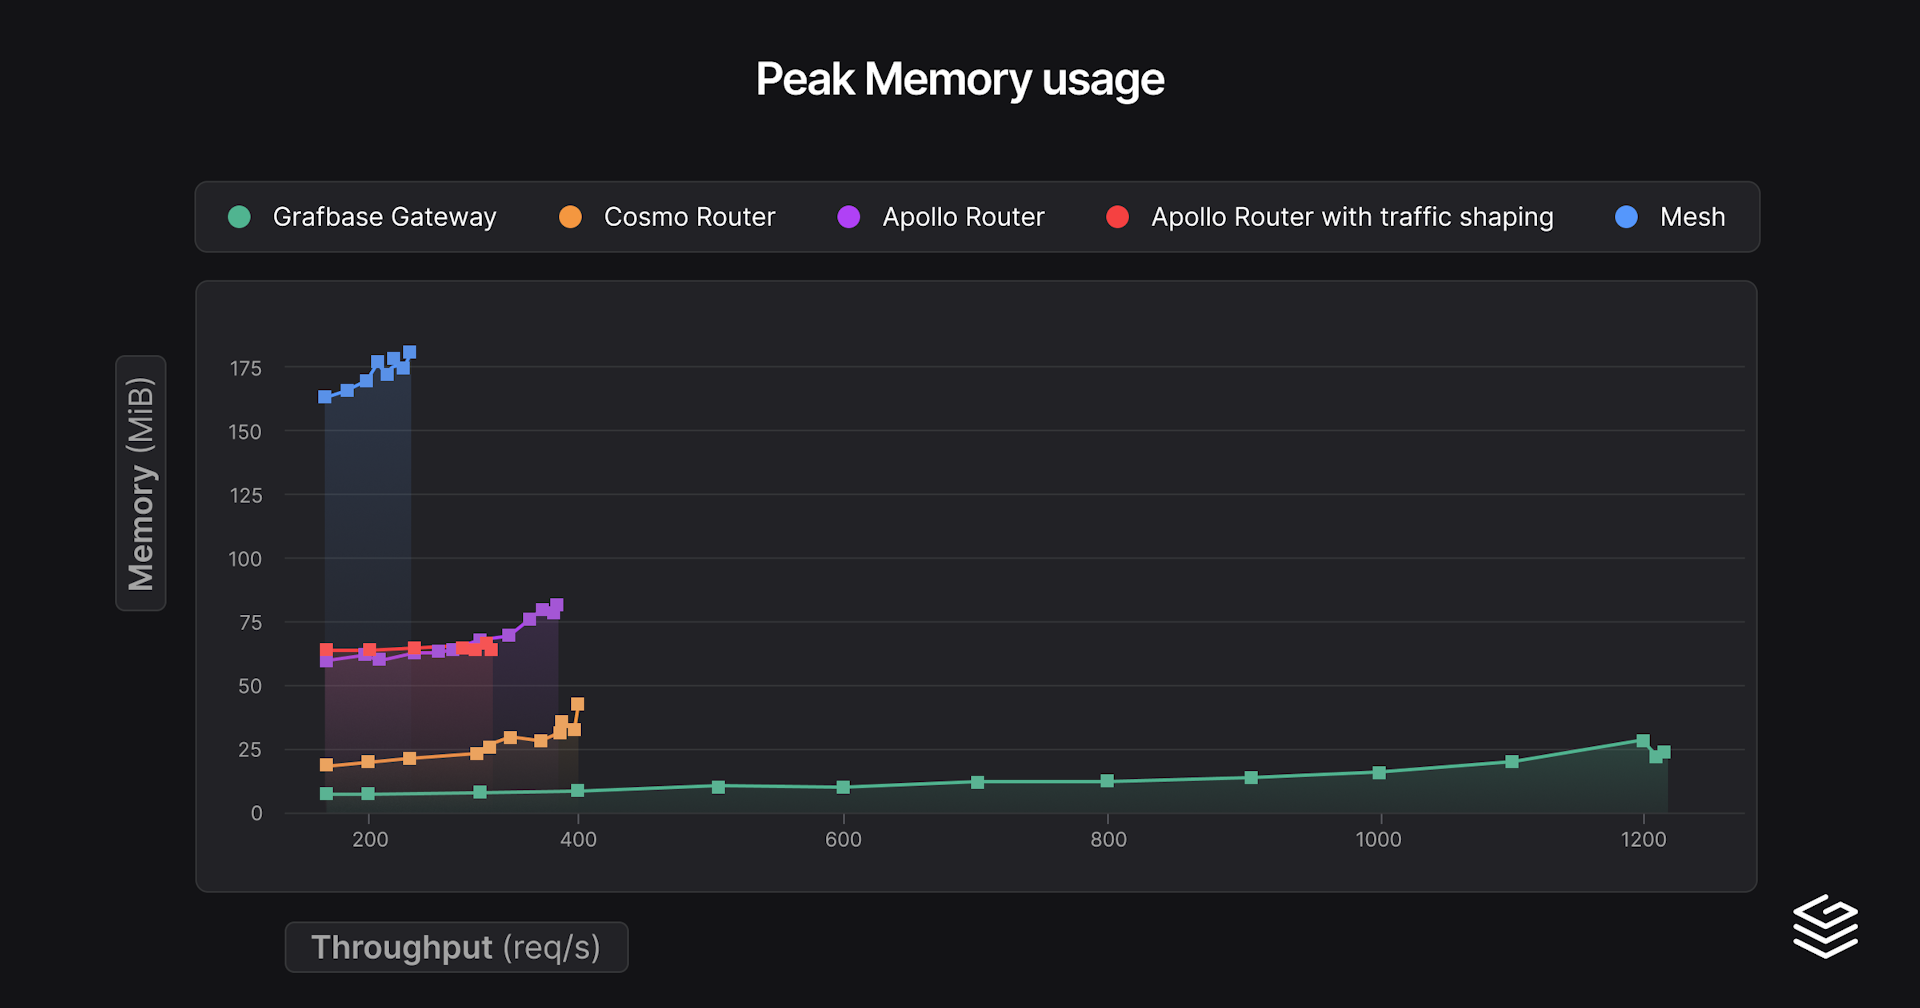
We also estimated the throughput, with linear interpolation, that could be handled with a 150% of the min p99 latency. This provides a rough estimation of the throughput you could expect without too much compromise on the latencies.
| Gateway | min p99 latency | Throughput at 150% min p99 latency (req/s) | Peak throughput | Peak RAM (MiB) |
|---|---|---|---|---|
| Grafbase Gateway | 2.3 | 908 (3.4 ms) | 1217 (15.2 ms) | 27 |
| Apollo Router | 3.9 | 264 (5.8 ms) | 313 (11.7 ms) | 64 |
| Apollo Router with traffic shaping | 4.0 | 240 (6.1 ms) | 368 (59.2 ms) | 81 |
| Cosmo Router | 4.6 | 306 (6.9 ms) | 402 (49.8 ms) | 44 |
| Mesh | 4.7 | 220 (7.0 ms) | 244 (16.8 ms) | 177 |
The results speak for themselves, Grafbase Gateway provides high throughput, with low RAM use and low latencies. Interestingly, with traffic shaping enabled (de-duplicating requests to subgraphs) on Apollo Router, latencies are worse, but throughput goes significantly further. Cosmo Router behaves similarly, having this behavior enabled by default, but with better performance.
For this second series of benchmarks we added an artificial constant 10ms response delay to the subgraphs. This imitates a 5ms network latency, as there is no delay for the request, which is a decent upper bound estimation of latencies within a data center. Here are the same graphs as before:
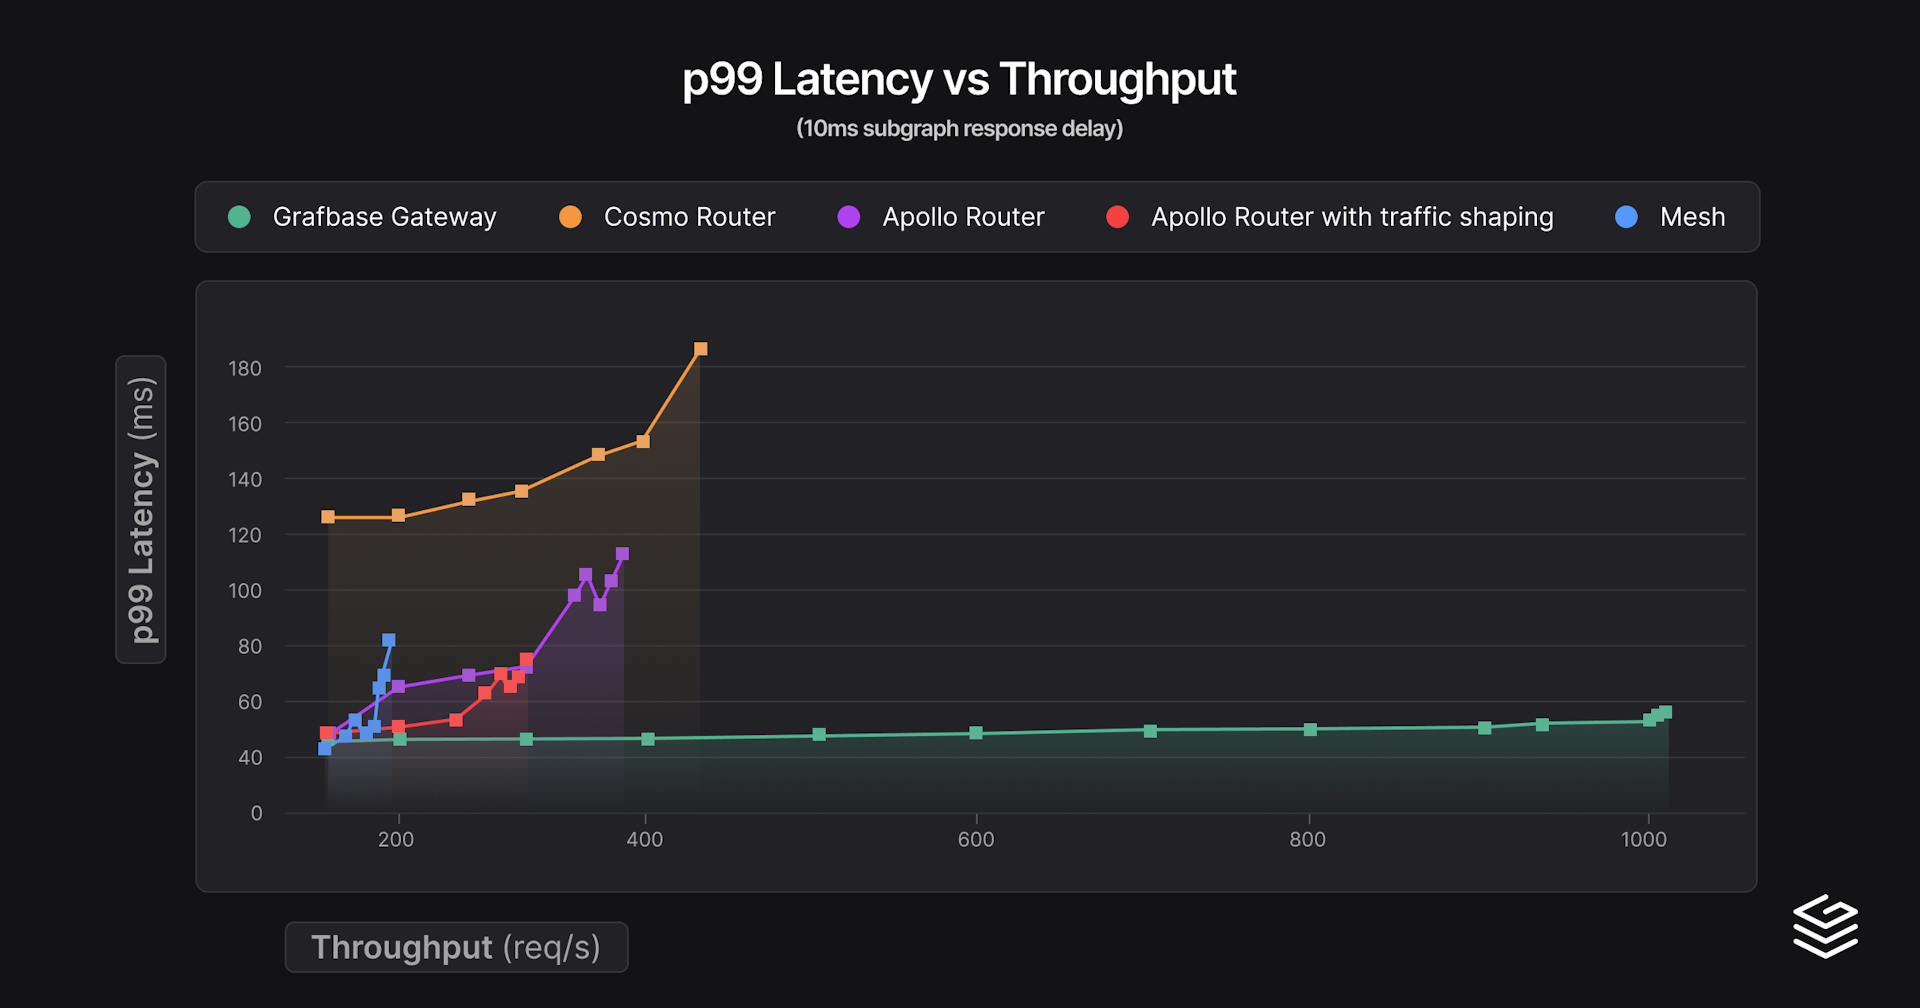
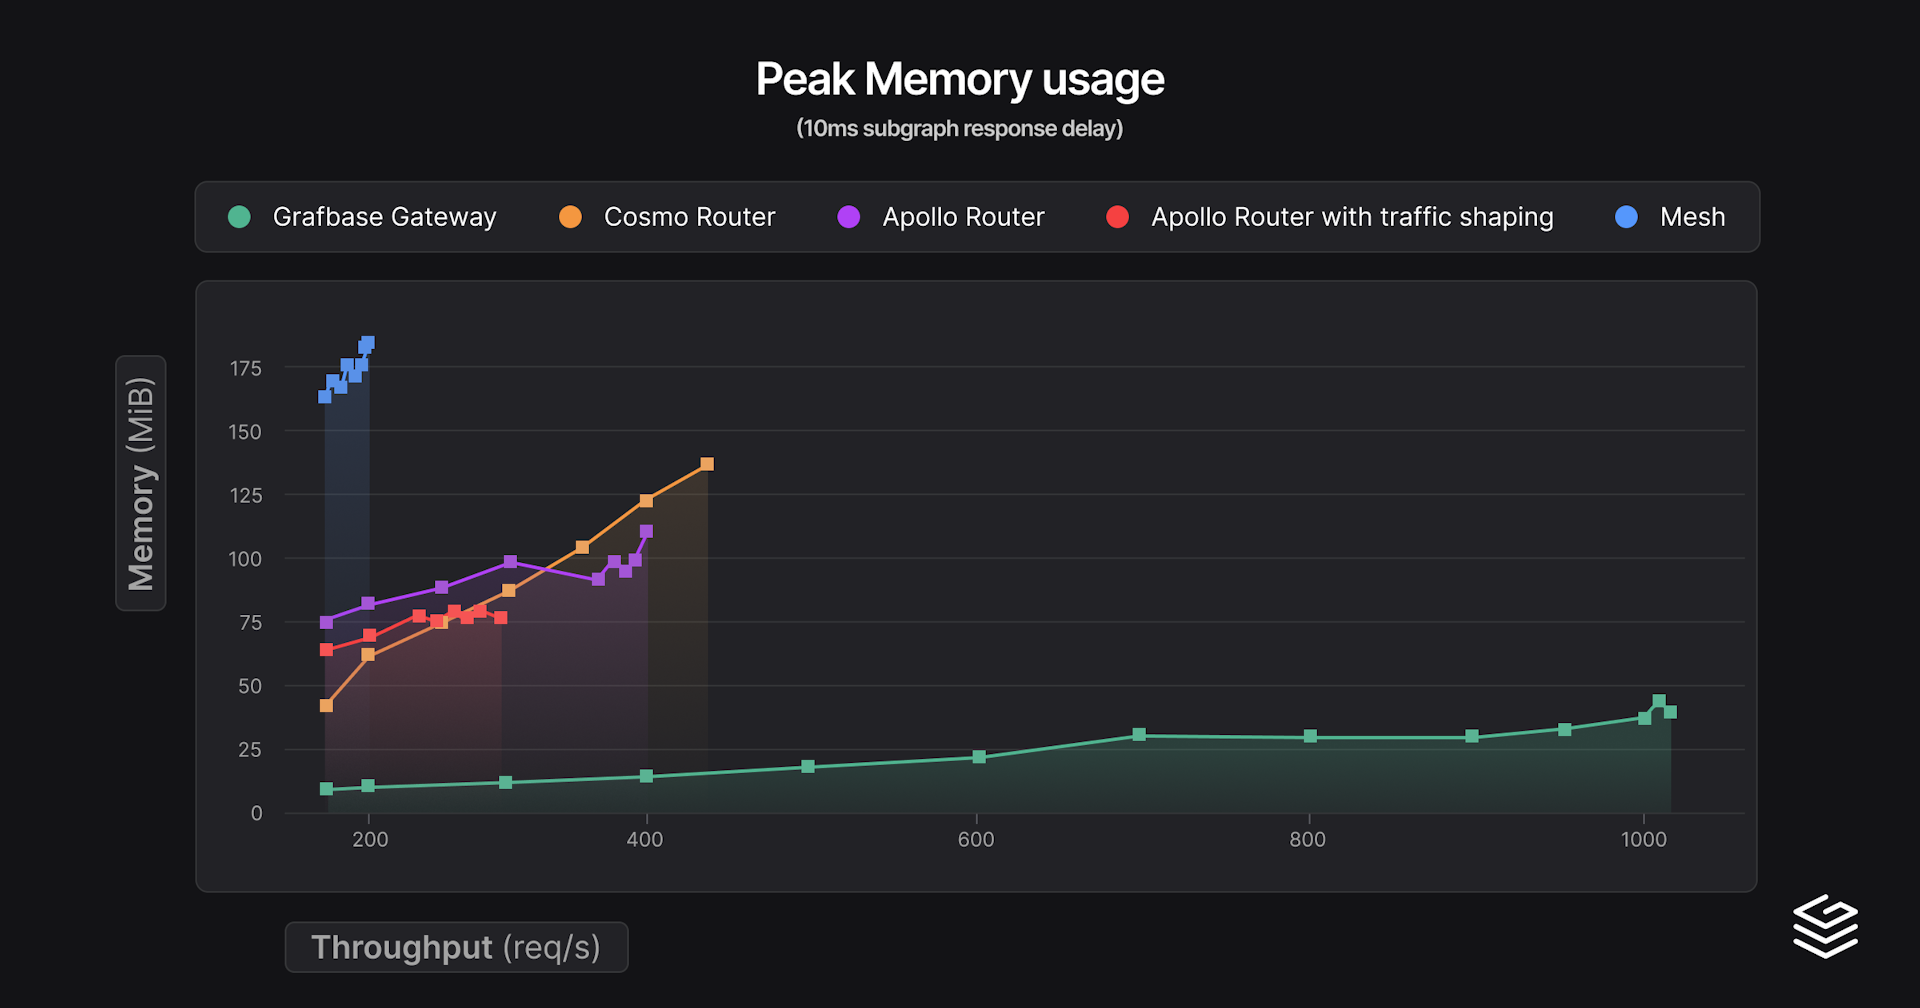
And the results:
| Gateway | min p99 latency | Throughput at 150% min p99 latency (req/s) | Peak throughput | Peak RAM (MiB) |
|---|---|---|---|---|
| Mesh | 41.2 | 188 (61.8 ms) | 198 (81.5 ms) | 183 |
| Grafbase Gateway | 47.4 | 1012 (57.0 ms) | 1012 (57.0 ms) | 44 |
| Apollo Router | 49.4 | 289 (74.1 ms) | 297 (78.7 ms) | 81 |
| Apollo Router with traffic shaping | 50.3 | 299 (75.4 ms) | 390 (115.2 ms) | 106 |
| Cosmo Router | 127.1 | 449 (185.1 ms) | 449 (185.1 ms) | 140 |
Now there are a lot of interesting details! Mesh actually has the best min p99 latency thanks to its federation entities cache, executing fewer subgraph requests in total. Cosmo Router behaves surprisingly worse. We notice the same pattern with traffic shaping, at the cost of higher latencies you can go further in terms of throughput.
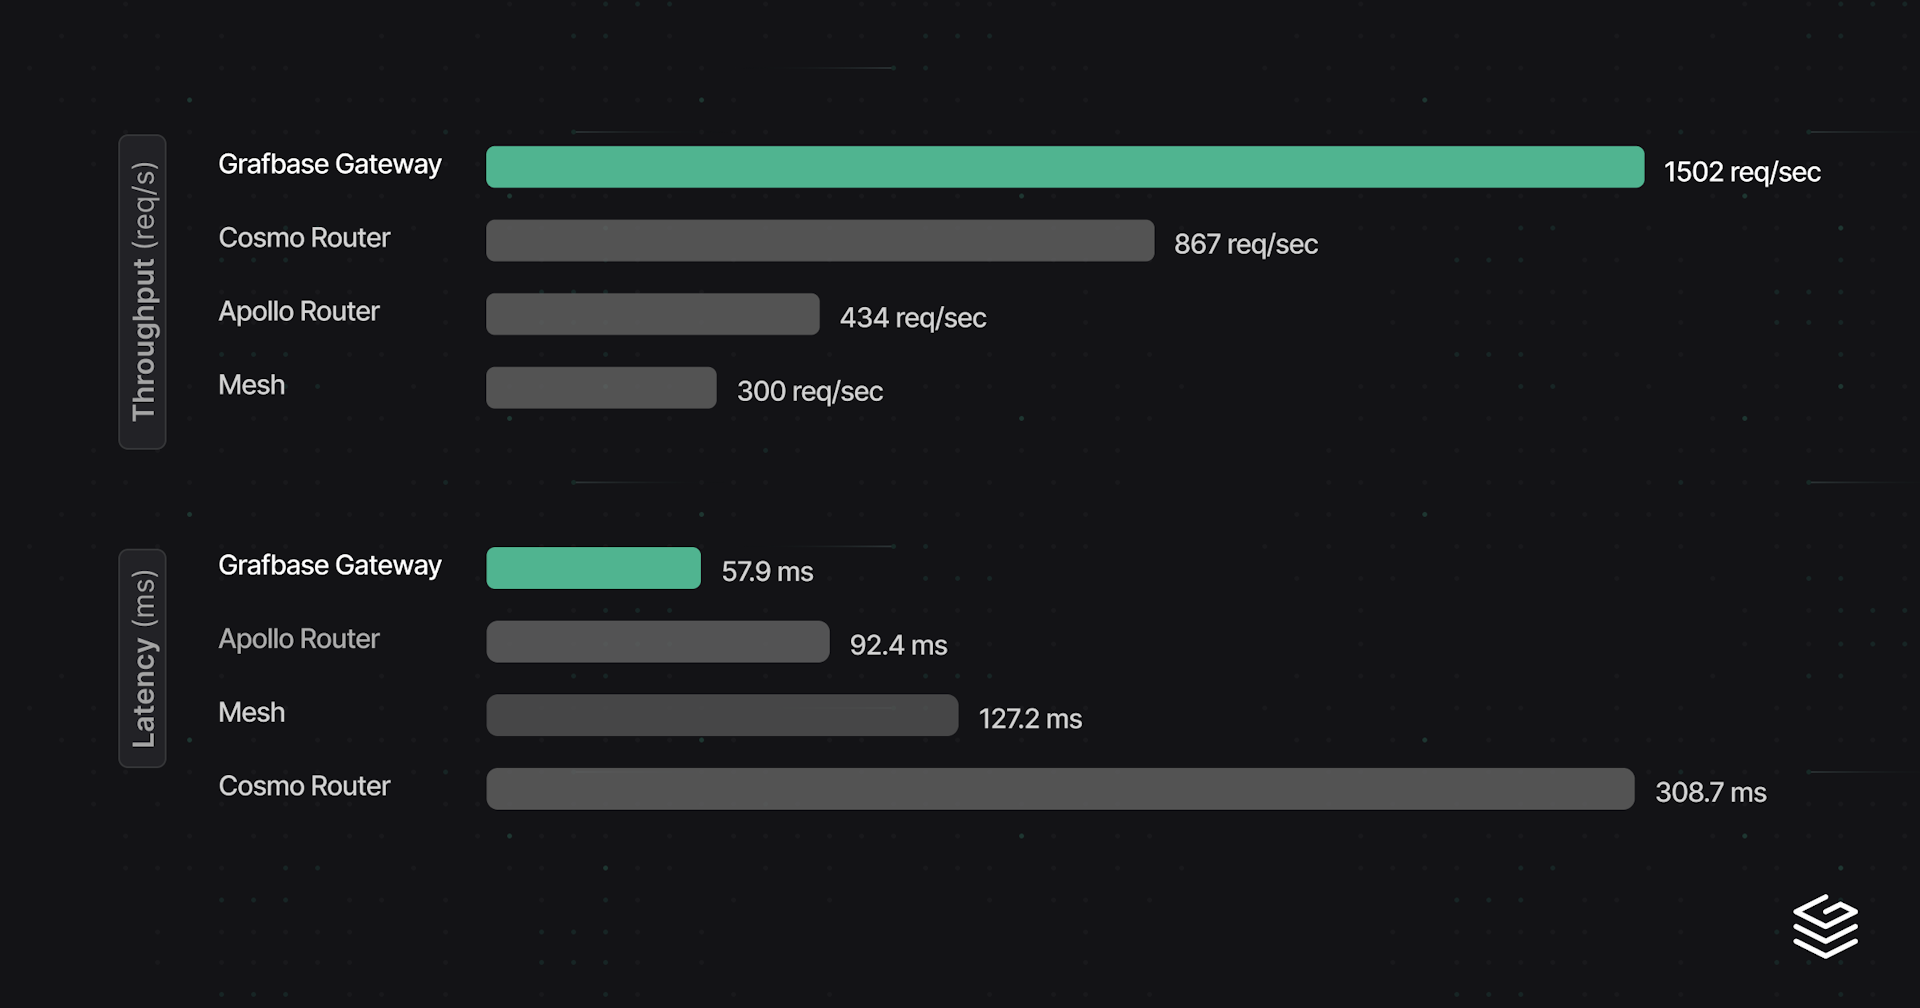
Finally, for the last benchmark series we doubled the amount of CPU cores.
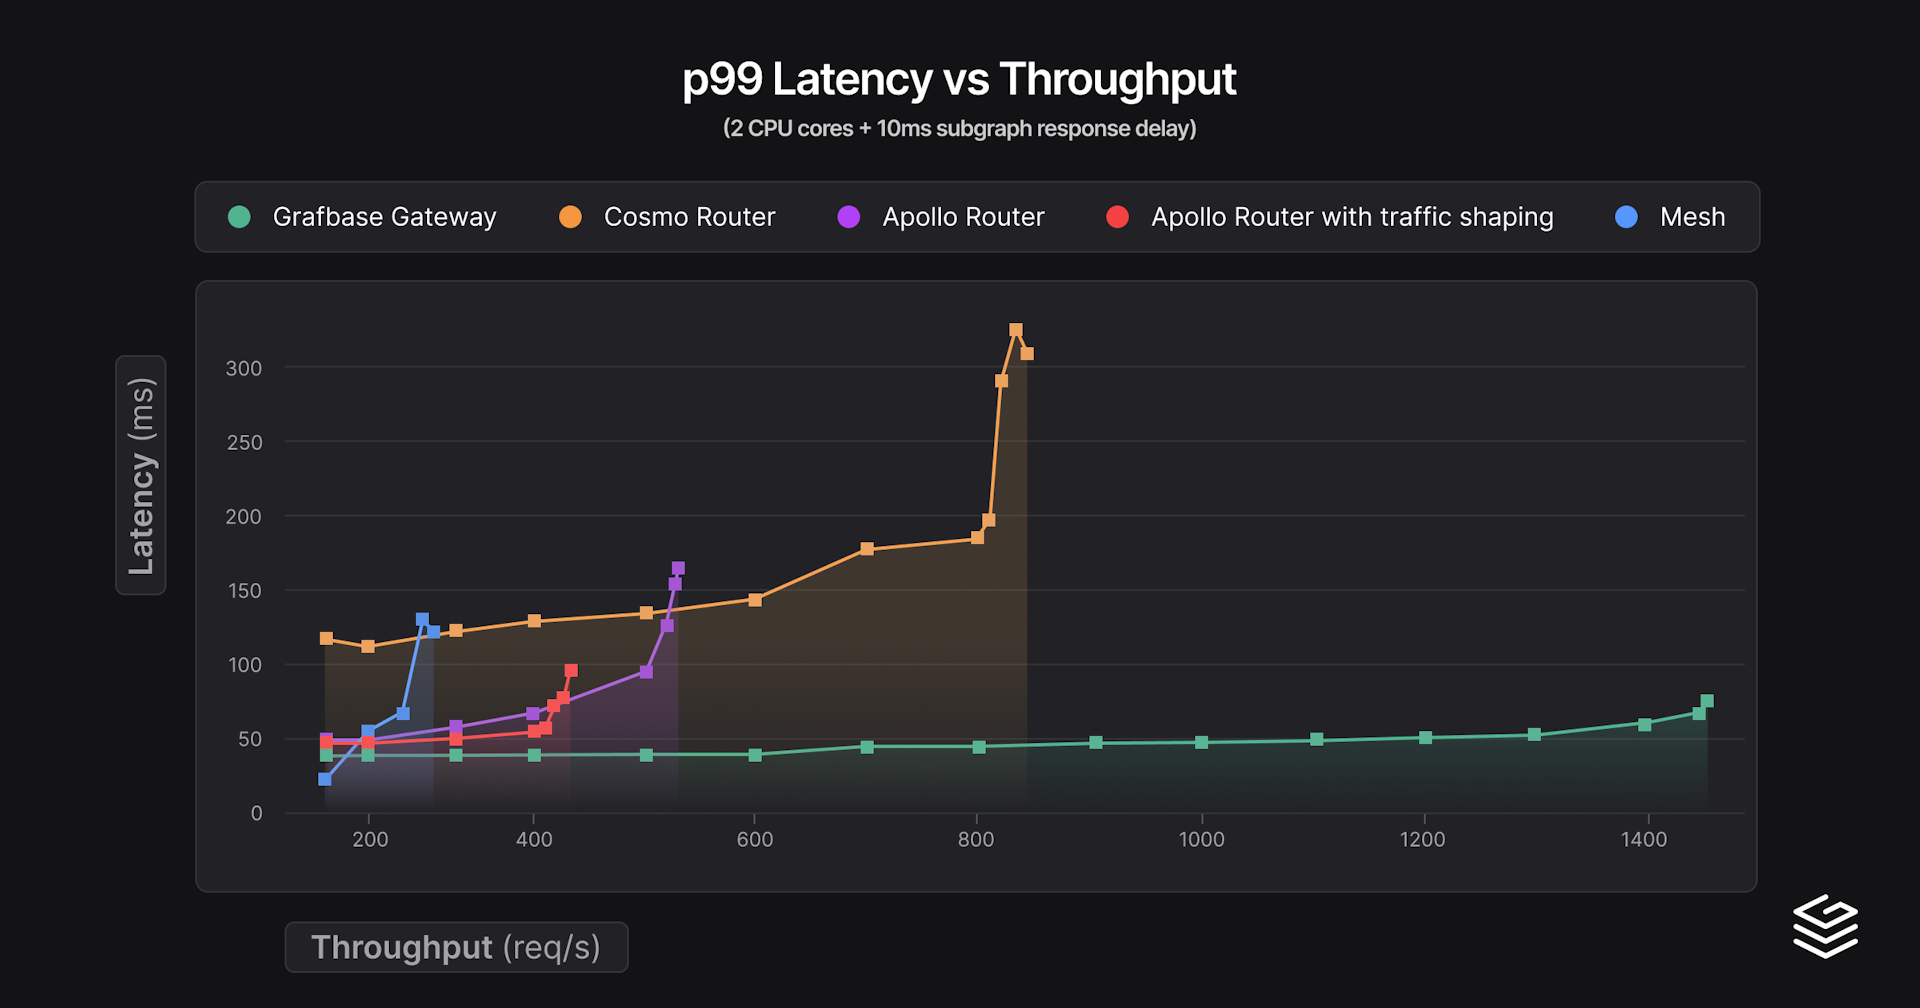
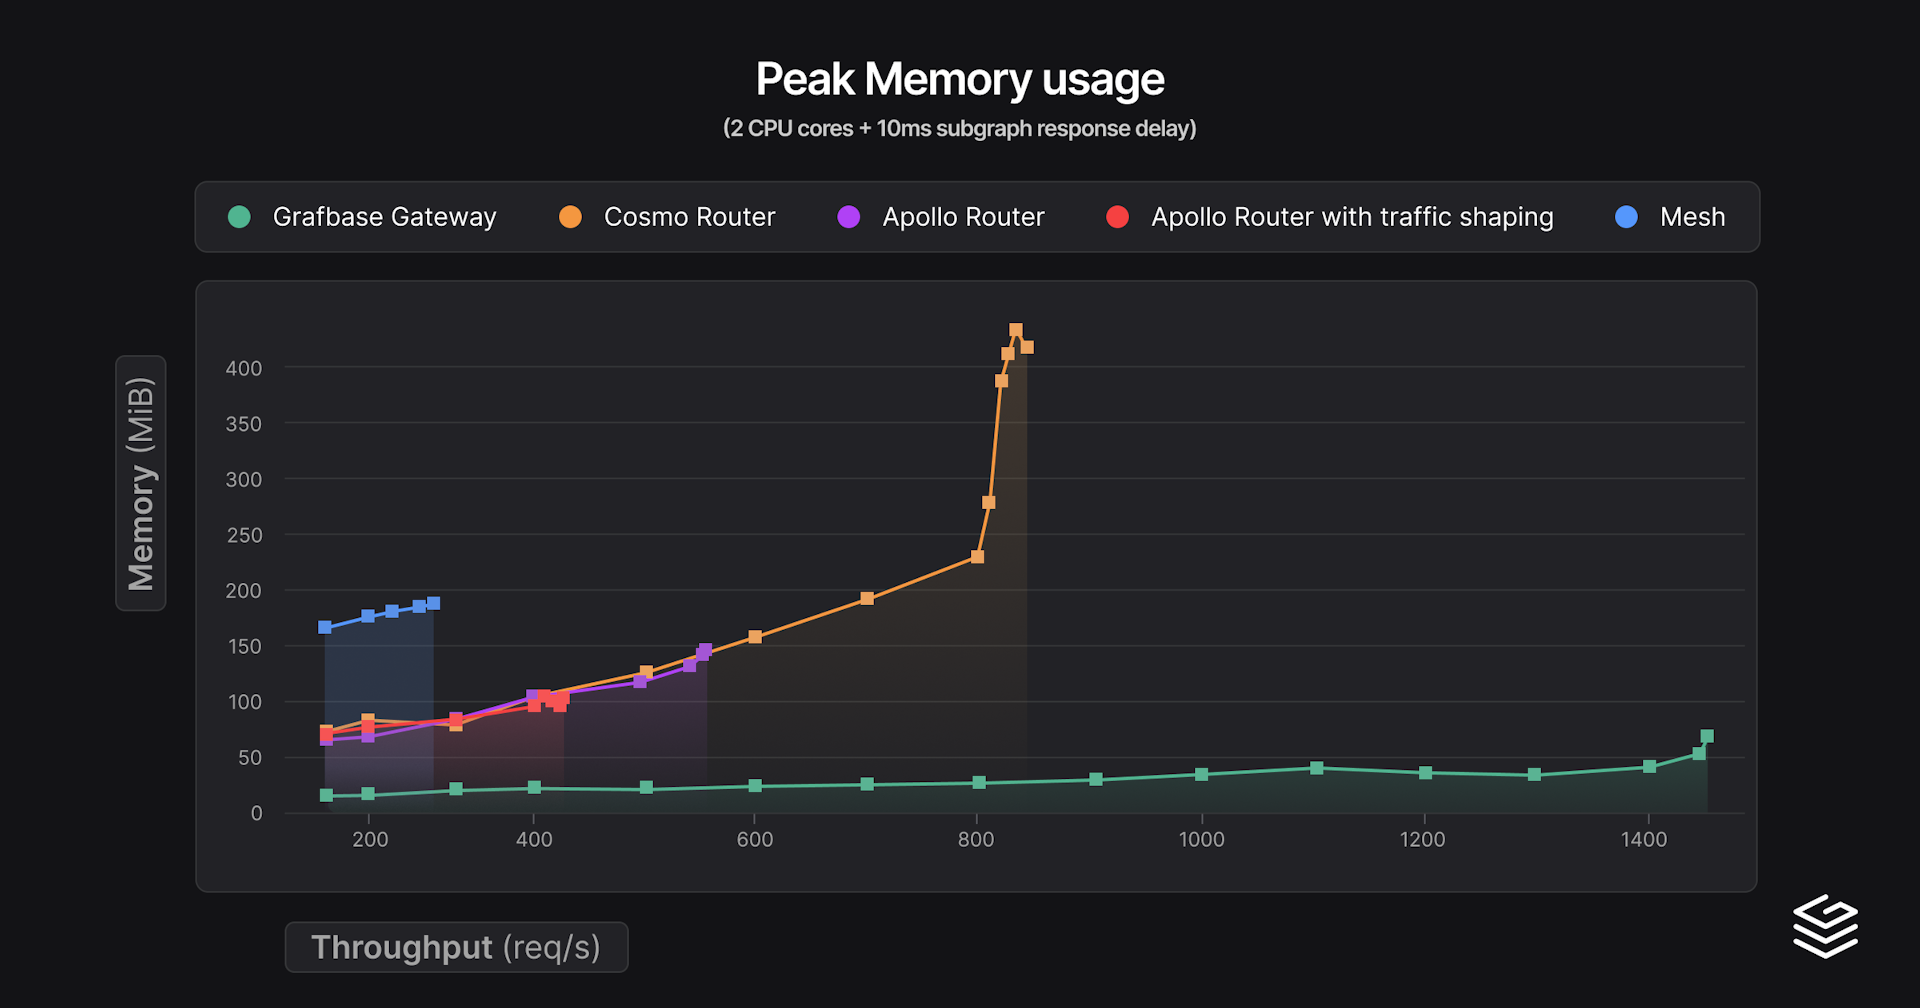
| Gateway | min p99 latency | Throughput at 150% min p99 latency (req/s) | Peak throughput | Peak RAM (MiB) |
|---|---|---|---|---|
| Mesh | 40.5 | 234 (60.8 ms) | 300 (127.2 ms) | 191 |
| Grafbase Gateway | 47.6 | 1502 (57.9 ms) | 1502 (57.9 ms) | 66 |
| Apollo Router | 49.4 | 429 (74.2 ms) | 434 (92.4 ms) | 105 |
| Apollo Router with traffic shaping | 49.7 | 409 (74.6 ms) | 552 (151.9 ms) | 144 |
| Cosmo Router | 123.3 | 800 (185.0 ms) | 867 (308.7 ms) | 419 |
In terms of latencies, nothing really changes. Cosmo Router scaled really well here, almost double the throughput. Memory consumption rose by a lot though, but in absolute terms, 420 MiB for 2 cores for complex queries is not bad either. Grafbase Gateway scaled less well than we expected but still has the best performance by a good margin overall.
Creating and executing good benchmarks is a science in itself, so please take all of this with a grain of salt. It's the same query running for 60 seconds with a lot of duplicated entities in the response. So typically this is an ideal use-case for Mesh entity caching and Apollo Router & Cosmo Router request deduplication. The latter significantly reduced the load on subgraphs which had low CPU consumption. Another solution for this would also be to use caching in the subgraphs, which should likely has less impact on latencies and easier to share across machines. In all cases, the best benchmark is the one testing your own workloads!
We've just shown that the Grafbase Gateway was significantly more performant in our benchmarks. So let's take a look at the core design decisions we made when building Grafbase Engine v2.
We store almost everything inside Vec (dynamic array). This provides lower memory consumption, faster access and is friendlier for the cache. The simplified GraphQL schema looks like this:
use std::ops::Range;

#[derive(Clone, Copy)]
struct StringId(usize);

#[derive(Clone, Copy)]
struct ObjectId(usize);

#[derive(Clone, Copy)]
struct FieldId(usize);

struct Schema {
    /// Interned strings (deduplicated)
    strings: Vec<String>,
    /// All objects
    objects: Vec<Object>,
    /// All object fields
    fields: Vec<Field>,
}

struct Object {
    name: StringId,
    /// Range of field ids pointing to a slice of Schema.fields.
    field_ids: Range<FieldId>,
}

struct Field {
    name: StringId,
}
For each ID we generate various utilities like Index:
impl std::ops::Index<ObjectId> for Schema {
    type Output = Object;

    fn index(&self, id: ObjectId) -> &Self::Output {
        &self.objects[id.0]
    }
}
And when we need to traverse various parts of the schema we have "walkers" which always have a reference to the Schema.
#[derive(Clone, Copy)]
struct SchemaWalker<'a, Id> {
    schema: &'a Schema,
    id: Id,
}

impl Schema {
    fn walk<Id>(&self, id: Id) -> SchemaWalker<'_, Id> {
        SchemaWalker { schema: self, id }
    }
}

type ObjectWalker<'a> = SchemaWalker<'a, ObjectId>;
type FieldWalker<'a> = SchemaWalker<'a, FieldId>;

impl<'a> ObjectWalker<'a> {
    fn name(&self) -> &'a str {
        let object = self.schema[self.id];
        &self.schema.strings[object.name.0]
    }

    fn fields(self) -> impl Iterator<Item = FieldWalker<'a>> + 'a {
        let object = self.schema[self.id];
        object.field_ids.iter().map(move |&id| FieldWalker {
            schema: self.schema,
            id,
        })
    }
}
This allows us to manipulate objects through it, exposing methods like name() which return a string reference rather than an ID:
let object = schema.walk(object_id);
// Get string name
object.name()
This design is re-used throughout the whole engine, reducing our memory footprint. It also provides a lot of flexibility, as we can treat those ids similar to references in a garbage collected language, but without any runtime cost: no reference counting, cyclic references, etc.
Simplifying the benchmark query, we first execute this query against the products subgraph:
query {
  topProducts {
    name
    price
    upc
    weight
  }
}
And then retrieve additional information from the inventory subgraphs:
query ($products: [_Any!]!) {
  _entities(representations: $products) {
    ... on Product {
      inStock
      shippingEstimate
    }
  }
}
At this stage we need to insert the subgraph response data into the original response. There are several subtle difficulties:
- We need to know where to insert our data into the final response, which might be deep within lists and objects.
- Propagating GraphQL errors with the correct response path to the first nullable parent field.
- Validate the incoming data.
- Ordering the fields matter in GraphQL, fields in the response must be in the same order as in the query.
To achieve all of this in an efficient manner, while also taking into account type conditions and fragments, the planning step first determines what to expect from the subgraph responses. Simplified, it generates the following:
/// Selection set we expected in the subgraph response
struct SelectionSet {
    fields: Vec<CollectedField>,
}

struct Field {
    /// Key in the final response
    key: ResponseKey,
    /// type of the field
    ty: FieldType,
    /// wrapping of the field (list / not null)
    wrapping: Vec<Wrapping>,
}

struct ResponseKey {
    /// Position of the response key within the query, explained a bit later
    query_position: usize,
    value: String,
}

/// Defines what data type to expect for this field
enum FieldType {
    Int,
    Float,
    String,
    SelectionSet(SelectionSet),
}

enum Wrapping {
    NonNull,
    List,
}
For our subgraph query we would have:
SelectionSet {
    fields: vec![
        Field {
            key: ResponseKey {
                query_position: 0,
                value: "inStock".to_string(),
            },
            ty: FieldType::Boolean,
            wrapping: vec![],
        },
        Field {
            key: ResponseKey {
                query_position: 3,
                value: "shippingEstimate".to_string(),
            },
            ty: FieldType::Int,
            wrapping: vec![],
        },
    ],
};
One important aspect here is that we keep track of the position of the field inside the query in ResponseKey, for shippingEstimate it's 3 because it's the third field in the fragment:
fragment Product on Product {
  inStock # 0
  name
  price
  shippingEstimate # 3
  upc
  weight
}
When receiving the subgraph response we validate and deserialize simultaneously into a ResponseValues with a custom serde::Deserialize skipping any intermediate values like serde_json::Value.
struct ResponseObject {
    // sorted by ResponseKey
    fields: Vec<(ResponseKey, ResponseValue)>,
}

enum ResponseValue {
    Boolean(bool),
    Int(i32),
    Float(f64),
    String(String),
    Object(ResponseObjectId),
    List(Vec<ResponseValueId>),
}
Even here you'll notice that we're using a Vec rather than a BTreeMap. It's actually a change we made during the benchmarks which improved performance by ~10%!
Lastly to avoid locks and minimize synchronizations between requests, each subgraph response will be deserialized independently of each other in a ResponsePart:
struct Response {
    parts: Vec<ResponsePart>,
}

struct ResponsePart {
    objects: Vec<ResponseObject>,
    values: Vec<ResponseValue>,
}

/// ResponseValues and ResponseObjects are stored in arrays, do you notice a pattern? :)
/// Here we need to additionally keep track of the part_id to uniquely identify an object across parts.
#[derive(Clone, Copy)]
struct ResponseValueId {
    part_id: usize,
    index: usize
}

#[derive(Clone, Copy)]
struct ResponseObjectId {
    part_id: usize,
    index: usize
};
When adding a new part to the response we're left with:
- Add fields to the right
ResponseObject: we track theResponseObjectIdthat'll receive updates later during the deserialization step. So in our previous example, we would create a list for all theProductobjects we deserialized for thetopProductsquery. When executing the second query, we don't need to search for them. - Propagate errors: Propagating error during the validation is easy, the function stack keeps track of our path within the response. But when it needs to propagate to the parent
ResponsePartit becomes considerably more complex. Instead, we add an error for the current response path and keep it for later. Before sending the final response, we traverse theResponsefor each of those and set the last nullable value we encounter as null.
Grafbase had the best results for latencies, throughput and memory usage in this benchmark series. Latencies were especially impressive at high throughput. Our core design choices made this possible by minimizing allocations use a more cache-friendly data model. During the benchmarks the most impactful change we made was the use of mimalloc, improving performance by a solid 15-20%! Finally, if you encounter a case where Grafbase doesn't provide high performance, we're more than happy to take a look at it!