# Grafbase Documentation
Grafbase is the easiest way to manage large scale federated graphs and is the fastest GraphQL Gateway on the market.
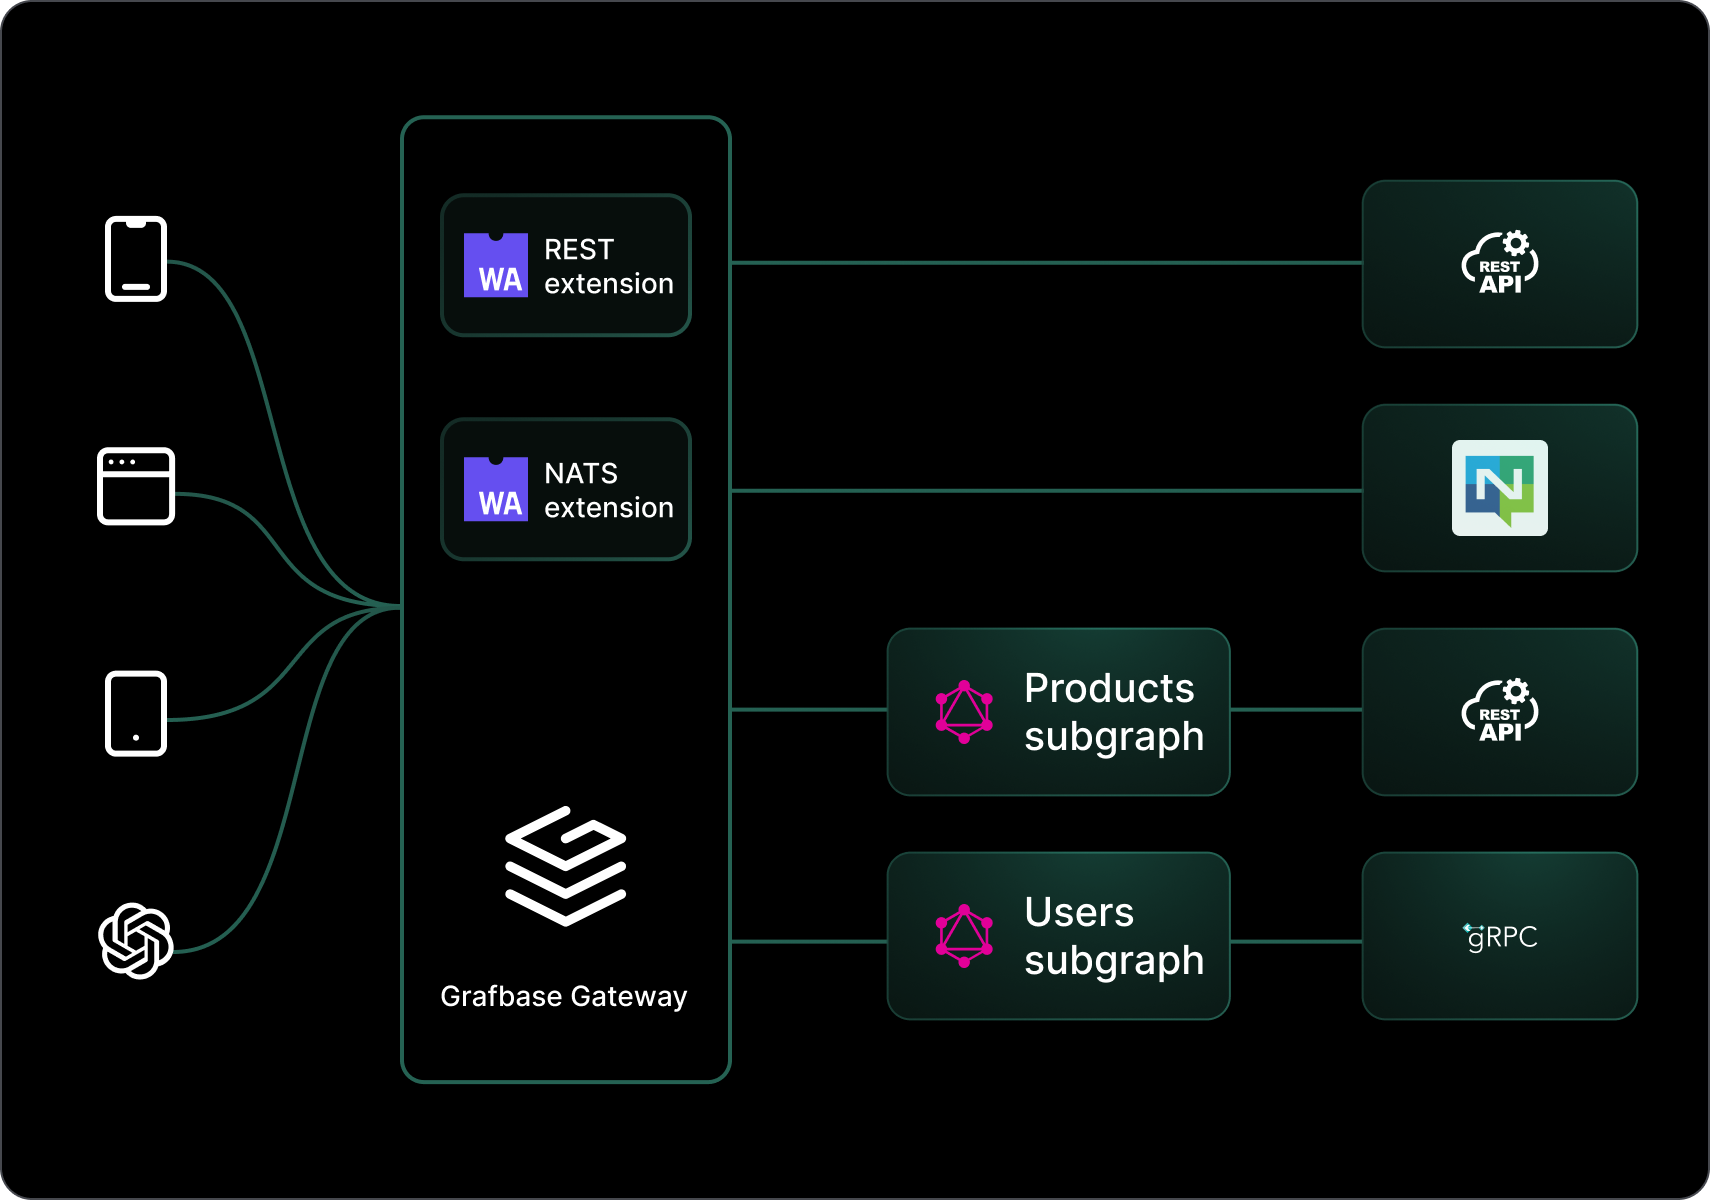
Compose your unified API from multiple data sources in just a few minutes with the Grafbase CLI.
## Get Started
Start building your federated graph in a few easy steps.
## Security
- [Trusted Documents](/docs/gateway/security/trusted-documents) let you define a set of trusted documents that can be used in your federated graph.
- [Rate Limiting](/docs/gateway/security/rate-limiting) helps you protect your federated graph from abuse.
- [Operation Limits](/docs/gateway/security/operation-limits) let you set limits on the number of operations that can be executed on your federated graph.
- [Message Signatures](/docs/gateway/security/message-signatures) let you sign messages to ensure their authenticity.
- [Authentication](/docs/gateway/security/authentication) restricts access to the gateway.
- [Authorization](/docs/gateway/security/authorization) restricts access to certain fields, objects, and more for a given operation.
- [Access Logs](/docs/gateway/security/access-logs) let you log access requests to your federated graph with custom hooks.
- [Access Tokens](/docs/gateway/security/access-tokens) let you manage access tokens to manage your federated graph.
## Performance
- [Automatic Persisted Queries](/docs/gateway/performance/automatic-persisted-queries) let you cache queries to improve performance.
- [Entity Caching](/docs/gateway/performance/entity-caching) lets you cache resolved entities to improve performance.
## Federation
- [Schema Registry](/docs/platform/schema-registry) lets you compose subgraphs into a single federated graph.
- [Schema Checks](/docs/platform/schema-checks) let you validate your subgraph against the federated graph schema.
## Observability
The Grafbase Gateway provides [logs](/docs/gateway/observability#logs), [metrics](/docs/gateway/observability#metrics), and [traces](/docs/gateway/observability#traces) to help you monitor and debug your federated graph. You can also store custom access log messages using the [Access Logs](/docs/gateway/security/access-logs) feature.
## Grafbase API
The [Grafbase Dashboard](/dashboard) is powered by the [Grafbase API](/docs/platform/api). This same API is available for users to manage their account and projects programmatically.
---
# Gateway - Installation
To install the Grafbase Gateway, run the following command:
```bash
curl -fsSL https://grafbase.com/downloads/gateway | bash
```
## Hybrid operation
In hybrid mode, the gateway fetches the current federated graph from the Grafbase platform. Create a federated graph in the Grafbase API, publish the subgraphs, and the gateway will always have the current graph running.
Start the gateway in hybrid mode with the graph reference and an organization access token:
```bash
GRAFBASE_ACCESS_TOKEN=token ./grafbase-gateway \
--config grafbase.toml \
--graph-ref graph@branch
```
`graph-ref` points to a graph created in the Grafbase API and its branch. If the branch is empty, the gateway uses the production branch by default.
Create the organization access token in the account settings under "Access Tokens" and ensure it has permission to read the graph.
The gateway polls for graph changes every ten seconds.
## Air-gapped operation
In air-gapped mode, the gateway never calls the Grafbase API. You must provide the federated graph SDL as a file.
Start the gateway in self-hosted mode:
```bash
./grafbase-gateway \
--config /path/to/grafbase.toml \
--schema /path/to/federated-schema.graphql \
--listen-address 127.0.0.1:4000
```
Every five seconds, the gateway checks for changes in the schema file and initializes itself with the modified contents if it detects any changes.
## Configuration
The Grafbase Gateway reads its configuration from a TOML file. Read the configuration reference for more information.
---
# Gateway - Deployment - Docker
The Grafbase Gateway is published as a Docker image to GitHub Container Registry.
Example `compose.yaml`:
```yaml
services:
grafbase:
image: ghcr.io/grafbase/gateway:latest
restart: always
volumes:
- ./grafbase.toml:/etc/grafbase.toml
environment:
GRAFBASE_GRAPH_REF: 'graph-ref@branch'
GRAFBASE_ACCESS_TOKEN: 'ACCESS_TOKEN_HERE'
ports:
- '5000:5000'
```
The above `compose.yaml` file will start the Grafbase Gateway with the latest version of the image, bind the configuration file `grafbase.toml` to the container, and set the environment variables `GRAFBASE_GRAPH_REF` and `GRAFBASE_ACCESS_TOKEN` to the desired graph reference and access token, respectively. The configuration file `grafbase.toml` should be present in the same directory as the `compose.yaml` file.
---
# Gateway - Deployment - Kubernetes
Deploy the Grafbase Gateway through different options that fit diverse infrastructure needs. Choose from a [multi-platform binary](https://github.com/grafbase/grafbase/releases?q=gateway) for direct installation on various operating systems, or use a [Docker image](https://github.com/grafbase/grafbase/pkgs/container/gateway) that integrates into containerized environments like Kubernetes. This flexibility lets teams deploy the gateway in ways that best fit their workflow on local machines, cloud platforms, or hybrid infrastructures.
## Kubernetes
Kubernetes offers popular container orchestration with wide adoption for its scalability, reliability, and powerful ecosystem. This ecosystem includes tools like Helm, which simplifies the deployment and management of Kubernetes workloads through a templated, versioned, and reusable configuration framework. Use Helm to package applications into charts and streamline complex workload deployments consistently across environments.
### Gateway Helm Chart
Grafbase provides a Helm chart to simplify gateway deployment. The GitHub Container Registry hosts it with [Open Container Initiative (OCI)](https://helm.sh/docs/topics/registries/) compliance. Find the chart and versions at:
```bash
https://ghcr.io/grafbase/helm-charts/gateway
```
## Deploying
The chart includes default installation configuration for quick gateway setup with minimal configuration. While functional and easy to start with, tune this setup to accommodate real use cases.
Follow these steps to install the default configuration and customize settings for:
1. Number of replicas
2. Auto-scaling
3. Compute resources
4. External federated schema
5. External configuration
### Setup
Complete these prerequisites before deploying:
1. _Kubernetes Cluster:_ Get access to a Kubernetes cluster. Set up a local cluster like [kind](https://kind.sigs.k8s.io/) if needed.
2. _helm:_ Install Helm. Get started [here](https://helm.sh/docs/intro/quickstart/).
3. _kubectl:_ Install kubectl and point it to your cluster. Get started [here](https://kubernetes.io/docs/tasks/tools/#kubectl).
### Basic deployment
Start running the gateway with:
```bash
helm install test oci://ghcr.io/grafbase/helm-charts/gateway --version
```
Verify gateway operation:
```bash
kubectl get pods
```
Look for a running pod named `test-gateway`.
### Customize deployment
Use a Helm [values file](https://helm.sh/docs/chart_template_guide/values_files/) to customize your deployment:
```yaml
# 1. number of desired replicas running
replicaCount: 2
# 2. auto-scaling behaviour
autoscaling:
enabled: true
minReplicas: 2
maxReplicas: 10
targetCPUUtilizationPercentage: 70
targetMemoryUtilizationPercentage: 70
# 3. compute resources
resources:
limits:
cpu: 2
memory: 2Gi
requests:
cpu: 1
memory: 1Gi
# 4. and 5. External schema and configuration from cluster configmaps
gateway:
externalConfig: true
externalSchema: true
args:
- --config
- /etc/grafbase/config/config.toml
- --schema
- /etc/grafbase/schema/schema.sdl
volumes:
- name: configuration
configMap:
name: grafbase-gateway-configuration
- name: schema
configMap:
name: grafbase-gateway-schema
volumeMounts:
- name: configuration
mountPath: /etc/grafbase/config
- name: schema
mountPath: /etc/grafbase/schema
```
This configuration:
1. Maintains 2 gateway replicas
2. Sets auto-scaling between 2 and 10 instances, scaling up at 70% CPU or memory usage
3. Allocates 1-2 CPU and 1-2GB memory per replica
4. Uses cluster configmaps for gateway configuration and federated schema, mounting them in specified paths
View all customizable values with:
```bash
helm show values oci://ghcr.io/grafbase/helm-charts/gateway --version
```
To apply customizations:
1. Save your settings to a file
2. Run:
```
helm upgrade test oci://ghcr.io/grafbase/helm-charts/gateway --version -f custom-values.yaml
```
Verify the deployment:
```bash
helm list
kubectl get pods
```
---
# Gateway - Deployment - Lambda
Deploy the Grafbase Gateway to the AWS Lambda platform as a serverless function. We provide a separate build targeting the Lambda platform for each gateway release. This has differences from running the gateway binary in a normal server environment. Select the correct builds for Lambda - normal builds won't work in AWS Lambda.
## Lambda Size Selection
The Grafbase Lambda Gateway uses minimal memory: common usage stays below hundred megabytes. The Lambda memory setting affects how much CPU AWS allocates for the function, so choosing a higher base memory amount can improve cold start times and general performance, even when the Gateway doesn't need the memory.
## Lambda Binary Selection
The [gateway release](https://github.com/grafbase/grafbase/releases) includes two Lambda-targeted binaries:
- `grafbase-gateway-lambda-aarch64-unknown-linux-musl` for Amazon Graviton platform, targeting 64-bit ARM architecture.
- `grafbase-gateway-lambda-x86_64-unknown-linux-musl` for 64-bit x86 platform.
The binaries won't work if you deploy them to the wrong CPU architecture. The aarch64 version is smaller, so using Graviton (when available in your region) can speed up cold starts due to the smaller size.
Lambda binaries work only in AWS Lambda or a Lambda-emulating docker image. These binaries optimize for size over runtime speed to minimize cold start time.
## Set up Lambda for the Grafbase Lambda Gateway
Configure the Lambda function as needed. Control Gateway execution settings through these environment variables:
- `GRAFBASE_CONFIG_PATH` sets the Grafbase configuration file path. Default: `./grafbase.toml`, looking for configuration in the Lambda root directory.
- `GRAFBASE_SCHEMA_PATH` sets the federated schema path. Default: `./federated.graphql`, looking in the Lambda root directory.
- `GRAFBASE_LOG` sets log level. Values: `error`, `warn`, `info`, `debug`, `trace` or `off`. Default: `info`.
- `GRAFBASE_LOG_STYLE` sets log message style. Values: `text` or `json`. Default: `text`.
## Deployment
Package the Grafbase Lambda Gateway with the gateway configuration and federated graph. Unlike a full server, Lambda functions freeze without traffic, preventing background graph updates. After publishing a new subgraph:
1. [Download](https://github.com/grafbase/grafbase/releases) your preferred Grafbase Lambda Gateway version
2. Rename the binary to `bootstrap`
3. Copy the configuration file to the same directory
4. Get the latest federated graph from the Grafbase API
Include these files in your deployment:
```bash
.
├── bootstrap
├── grafbase.toml
└── federated.graphql
```
Deploy following the [AWS documentation](https://docs.aws.amazon.com/lambda/latest/dg/gettingstarted-package.html).
## Configuration differences
Configure the Grafbase Lambda Gateway with the same configuration file as the binary, with these changes:
- AWS defines listen address and port - network settings don't apply
- AWS handles transport layer security - TLS settings in Grafbase configuration don't apply
- OpenTelemetry settings work similarly, but batching doesn't affect Lambda
- Set CORS from Gateway configuration or Lambda settings
## OpenTelemetry
We recommend using [AWS X-Ray](https://aws.amazon.com/xray/) for OpenTelemetry tracing in Lambda. The Grafbase Lambda Gateway propagates span IDs in X-Ray format and connects Lambda traces to Gateway traces.
Because functions sleep without traffic, you must flush traces before request responses. This increases response times. Run an OLPC collector in the same datacenter as your Lambda function. Install the [AWS distro for OpenTelemetry Collector](https://aws-otel.github.io/docs/setup/ec2) in Amazon Elastic Computer Cloud. Place the EC2 instance in the same region and virtual private network for best performance.
Configure the Grafbase Lambda Gateway to send traces to your functional OpenTelemetry collector:
```toml
[telemetry]
service_name = "my-federated-graph"
[telemetry.tracing]
enabled = true
sampling = 1
[telemetry.tracing.propagation]
aws_xray = true
[telemetry.tracing.exporters.otlp]
enabled = true
endpoint = "http://:4317"
protocol = "grpc"
timeout = 5
```
---
# Gateway - Extensions
Extensions are a powerful feature of the Grafbase Gateway that lets you extend its functionality with custom code. You write extensions in Rust and compile them into a WebAssembly module that the [Grafbase Gateway](/docs/gateway/installation) loads. Extensions implement custom authentication, authorization, and resolving logic, and integrate with external services and APIs.
Read more about [configuring the extensions in gateway](/docs/gateway/configuration/extensions), and [a guide on implementing one](/guides/implementing-a-gateway-resolver-extension).
## Extensions Architecture
An extension is a WebAssembly module with a JSON manifest. You add them to your gateway installation through configuration, and the gateway loads them automatically when it starts.
Two types of extensions exist: resolver extensions and authentication extensions. Resolver extensions extend the functionality of the gateway's resolvers, while authentication extensions extend the functionality of the gateway's authentication system.
We mainly support Rust to implement extensions. Grafbase provides a [Rust SDK](https://docs.rs/grafbase-sdk/latest/grafbase_sdk/) that makes implementing extensions easy. The SDK provides traits that you implement to extend the functionality of the gateway's resolvers and authentication system.
## Extension Manifest
The extension manifest is a JSON file that describes the extension's metadata and configuration. The Grafbase Gateway uses it to load and configure the extension.
The manifest file must contain the following fields:
- `name`: The name of the extension.
- `version`: The version of the extension.
- `kind`: The type of the extension (`resolver` or `authentication`).
- `sdk_version`: The version of the Grafbase SDK used to implement the extension.
- `minimum_gateway_version`: The minimum version of the Grafbase Gateway required to run the extension.
- `sdl`: The GraphQL directives and types the extension provides.
This file is called `manifest.json` in the extension's root directory.
## Extension Implementation
The extension logic compiles into a WebAssembly component and implements the [WASI Preview 2](https://github.com/WebAssembly/WASI/blob/main/wasip2/README.md) standard. This gives WebAssembly components more tooling to perform previously impossible tasks. These include network access with TCP or UDP, file system access, environment variable access and more.
An extension configuration defines what features the specific extension can access in its sandbox. You configure per-extension options in the gateway configuration to control what the extension can and cannot access.
The [Grafbase Rust SDK](https://docs.rs/grafbase-sdk/latest/grafbase_sdk/) provides the traits for implementing an extension, and the [Grafbase CLI](/docs/cli/installation) provides the commands for building and deploying extensions.
## Vision
We believe the Grafbase Gateway should serve as a platform to combine multiple data sources into a single GraphQL API. Extensions enable us to provide faster implementation of connections that were not previously feasible in the gateway itself. Our simple development tooling makes it easier for you to implement such connections.
For example, if your company uses a service that requires a custom protocol, you can implement an extension to connect to that service.
Although we license the Grafbase Gateway under the Mozilla Public License 2.0, we do not expect you to follow the same licensing with extensions. You can either submit a pull request with your extension code to make it available to the community, or keep it private for internal use.
---
- [v1.0](/docs/gateway/extensions/specs/grafbase-spec/v1.0)
---
# Gateway - Extensions - Specs - Grafbase directives & types for extensions - v1.0
This document defines the directives and types that have special treatment in the Grafbase gateway. They are meant to be used as building blocks for extension directives. The gateway will automatically detect them and inject the right data in their stead.
Here after is the full definition:
```graphql
"""
String specifying a selection set over the arguments which should be provided at runtime.
"""
scalar InputValueSet
"""
String specifying a selection set over the response data which should be provided at runtime.
"""
scalar FieldSet
# Template family
"String template rendered at runtime with URL escaping."
scalar UrlTemplate
"String template rendered at runtime with JSON escaping."
scalar JsonTemplate
```
Import me with:
```graphql
extend schema
@link(url: "https://specs.grafbase.com/grafbase", import: ["FieldSet"])
```
## InputValueSet
```graphql
"""
String specifying a selection set over the arguments which should be provided at runtime.
"""
scalar InputValueSet
```
The `InputValueSet` scalar is used to inject arguments into a directive. It's a `String` that defines a selection set such as `"ids filter { age }"` on the field arguments with a special case `"*"` that will inject all the arguments as shown in the following example:
```graphql
# Extension SDL
directive @myDirective(input: InputValueSet) on FIELD_DEFINITION
# ---
# Subgraph SDL
type Query {
# Receives all arguments
users(ids: [ID!], filter: Filter): [User!] @myDirective(input: "*")
# Which is equivalent to the following
users(ids: [ID!], filter: Filter): [User!] @myDirective(input: "ids filter")
# Fine-grained selection
users(ids: [ID!], filter: Filter): [User!]
@myDirective(input: "filter { age }")
}
input Filter {
name: String
age: Int
}
type User {
id: ID!
}
```
Contrary to field selection sets used in operations, there is a relaxed rule for leaves: one can select `"filter"` without specifying any sub-selection despite being an input object. The whole `Filter` input object will be provided in that case.
`InputValueSet` can be used in any extension directive definitions, but outside of `FIELD_DEFINITION` location, any non-null `InputValueSet` value will raise an error:
```graphql
# Valid
type User @myDirective {
id: ID!
}
# Valid
type User @myDirective(input: null) {
id: ID!
}
# Invalid, will raise an error.
type User @myDirective(input: "*") {
id: ID!
}
```
## FieldSet
```graphql
"""
String specifying a selection set over the response data which should be provided at runtime.
"""
scalar FieldSet
```
The `FieldSet` scalar is used to inject response data into a directive. It's a `String` that defines a field selection set such as `"id name"` on the _current_ object or interface:
```graphql
# Extension SDL
directive @myDirective(fields: FieldSet) on FIELD_DEFINITION
# ---
# Subgraph SDL
type User {
id: ID!
name: String
pets(limit: Int!): [Pet!]
catLoverFriends: [User!]
@myDirective(fields: "id pets(limit: 10) { ... on Cat { id } }")
}
union Pet = Cat | Dog
type Dog {
id: ID!
}
type Cat {
id: ID!
}
```
Except named fragments, `FieldSet` accepts any valid field selection set with field arguments or inline fragments. The gateway will do its best to re-use existing operation fields if they match, but will request anything additional.
`FieldSet` can be used in any extension directive definitions, but outside of `FIELD_DEFINITION`, `OBJECT` and `INTERFACE` locations, any non-null `FieldSet` value will raise an error:
```graphql
# Valid
union Pet = Cat | Pet @myDirective
# Valid
union Pet = Cat | Pet @myDirective(fields: null)
# Invalid, will raise an error.
union Pet = Cat | Pet @myDirective(fields: "... on Cat { id }")
```
## Templates
```graphql
"String template rendered at runtime with URL escaping."
scalar UrlTemplate
"String template rendered at runtime with JSON escaping."
scalar JsonTemplate
```
Templates are rendered by the gateway before being sent over to the extension. We support two variants of templates:
- `UrlTemplate`: for URLs, values will be URL-encoded. Complex values such as objects or lists will be first serialized to JSON and then URL-encoded.
- `JsonTemplate`: for JSON, values will be rendered as their serialized JSON value.
The following variables are accessible in the template:
- `args`: the arguments of the field
We use a subset of [Mustache](https://mustache.github.io/) template syntax:
- values: `{{val}}`
- nested fields: `{{object.field}}`
- current object: `{{.}}`
- nested block such `{{#object}} {{field}} {{/object}}` scope the content to the parent value. So `field` refers to `object.field`. Furthermore if used on a list such as `{{#objects}} {{field}} {{/objects}}` will render `field` for all the objects in the list.
- We have custom blocks `-last` and `-first` which only render for the last element and the first element of a list respectively. But more importantly, we support their opposite: `^-last` and `^-first` rendering for all but the last and but the first respectively, which most notably allows building JSON lists:
```mustache
{{#objects}} {{field}} {{^-last}},{{/-last}} {{/objects}}
```
Here after are a few examples using `UrlTemplate` and `JsonTemplate`:
```graphql
# Extension SDL
directive @myDirective(url: UrlTemplate, json: JsonTemplate) on FIELD_DEFINITION
# ---
# Subgraph SDL
type Query {
# user(id: "1") -> "/users/1"
user(id: ID!): User @myDirective(url: "/users/{{ args.id }}")
# users(ids: ["1", "2"]) -> "/users?ids=%5B%221%22%2C%222%22%5D"
users(ids: [ID!]): [User!] @myDirective(url: "/users?ids={{ args.ids }}")
# users(ids: ["1", "2"]) -> "/users?ids=1,2"
users(ids: [ID!]): [User!]
@myDirective(
url: "/users?ids={{#args.ids}}{{.}}{{^-last}},{{/-last}}{{/args.ids}}"
)
# users(filter: { name: "Alice" }) -> `{"name":"Alice"}`
users(ids: [ID!], filter: Filter): [User!]
@myDirective(json: "{{ args.filter }}")
# users(filter: { name: "Alice" }) -> `"Alice"`
users(ids: [ID!], filter: Filter): [User!]
@myDirective(url: "{{ args.filter.name }}")
}
input Filter {
name: String
age: Int
}
type User {
id: ID!
}
```
---
- [v1.0](/docs/gateway/extensions/specs/composite-schemas-spec/v1.0)
---
# Gateway - Extensions - Specs - Composite schemas with Grafbase - v1.0
The GraphQL Composite Schemas Spec is being actively worked upon on [GitHub](https://github.com/graphql/composite-schemas-spec). Most importantly for readers are:
- [Source Schema directives](https://github.com/graphql/composite-schemas-spec/blob/main/spec/Section%202%20--%20Source%20Schema.md) defining the directives that may be used by subgraphs such as `@lookup`.
- [FieldSelectionMap specification](https://github.com/graphql/composite-schemas-spec/blob/main/spec/Appendix%20A%20--%20Field%20Selection.md) used in `@is` and `@require`.
The Grafbase Gateway partially implements the specification with the goal of implementing it fully over time. In addition, we also extend the specification to better fit the use case of non-GraphQL data sources.
The current document describe both the current implemented parts of the specification and any additions we made.
# Directives
Directives can be imported with `@link` similarly to Apollo Federation's directives:
```graphql
extend schema
@link(
url: "https://specs.grafbase.com/composite-schemas/v1"
import: ["@lookup", "@key"]
)
```
In all examples within this document, directives will be imported with this `@link` directive if not specified explicitly.
It is not possible to use both Apollo Federation and Composite Schemas together in the same subgraphs. But a super graph can be composed of subgraphs used either.
## Not implemented
- `@internal`
- `@require` (coming soon)
## Common directives with Apollo Federation
`@external`, `@inaccessible`, `@shareable`, `@provides` and `@override` are implemented in the same way for both Apollo Federation and Composite Schemas.
`@key` in Composite Schemas is treated as a non-resolvable Apollo Federation `@key`. So `@key(fields: "id")` is implicitly `@key(fields: "id", resolvable: false)`.
Resolvable in that context means that the subgraph can provide the entity through Apollo Federation's custom `_entities` field. So `@key` in Composite Schemas only
defines the key fields, without specifying how the entities can be retrieved. A subgraph only defining the following does not provide any means for the supergraph to
retrieve a `Post` entity. `_entities` and `_service` are not assumed to exist. See `@lookup` directive to provide entities.
```graphql
extend schema
@link(
url: "https://specs.grafbase.com/composite-schemas/v1"
import: ["@key"]
)
type Post @key(fields: "id") {
id: ID!
}
```
## @lookup
```graphql
directive @lookup on FIELD_DEFINITION
```
`@lookup` defines how entities can be accessed by the supergraph. In the following example `@lookup` would automatically be used to a `Post` entity.
```graphql
type Query {
post(id: ID!): Post! @lookup
}
type Post @key(fields: "id") {
id: ID!
}
```
Today the Grafbase Gateway only supports the batch variant, which doesn't exist in the Composite Schemas spec, for extensions like [Postgres](/extensions/postgres):
```graphql
type Query {
posts(ids: [ID!]): [Post!] @lookup
}
type Post @key(fields: "id") {
id: ID!
}
```
`@lookup` will automatically detect the right argument to inject for single and composite keys as long as there isn't any ambiguity. Only one `@lookup` can exists in a subgraph for any given `@key`.
Support for single lookup for any resolver extensions/GraphQL subgraphs and explicit mapping with `@is` is coming soon.
## @derive
```graphql
directive @derive on FIELD_DEFINITION
```
The `@derive` directive creates a virtual entity field when the original data only exposes ids.
It doesn't exist in the Composite Schemas Spec, we added it to simplify the integration of non-Graphql data sources such as REST or gRPC.
```graphql
type Query {
posts: [Post!]!
}
type Post {
authorId: ID!
# This field is not provided by the subgraph
author: User! @derive
}
type User @key(fields: "id") {
id: ID!
}
```
The `author` field is resolved by the supergraph, derived from the `authorId` field. This simple adjustment makes it possible to query fields from other subgraphs:
```graphql
{
posts {
author {
id
name
}
}
}
```
`@derive` will, similarly to `@lookup`, automatically detect the relevant fields based on their name and type given the defined `@key`.
A derived field _must_ match at least one `@key`.
It may provide more fields or multiple keys, and you can also hide the real subgraphs fields from your final API schema with `@inaccessible`:
```graphql
type Post {
authorId: ID! @inaccessible
# This field is not provided by the subgraph
author: User! @derive
}
```
`@derive` supports multiple use cases and can be explicitly specified with the help of the `@is` directive:
- Single key:
```graphql
type Post {
authorId: ID!
author: User! @derive
# or
author: User! @derive @is(field: "{ id: authorId }")
}
type User @key(fields: "id") {
id: ID!
}
```
- Composite key:
```graphql
type Post {
authorTenantId: ID!
authorEmail: String!
author: User! @derive
# or
author: User!
@derive
@is(field: "{ tenantId: authorTenantId email: authorEmail }")
}
type User @key(fields: "tenantId email") {
tenantId: ID!
email: String!
}
```
- Single key list
```graphql
type Post {
commentIds: [ID!]
comments: [Comment!]! @derive
# or
comments: [Comment!]! @derive @is(field: "commentIds[{ id: . }]")
}
type Comment @key(fields: "id") {
id: ID!
}
```
- Composite key list
```graphql
type Post {
reviewersTenantIdAndEmail: [TenantIdAndEmail!]!
reviewers: [User!]! @derive
# or
reviewers: [User!]!
@derive
@is(field: "reviewersTenantIdAndEmail[{ tenantId email }]")
}
type TenantIdAndEmail {
tenantId: ID!
email: String!
}
type User @key(fields: "tenantId email") {
tenantId: ID!
email: String!
}
```
The only limit to `@derive` today is that nested fields are not supported.
## @is
See `@lookup` and `@derive` for more information.
---
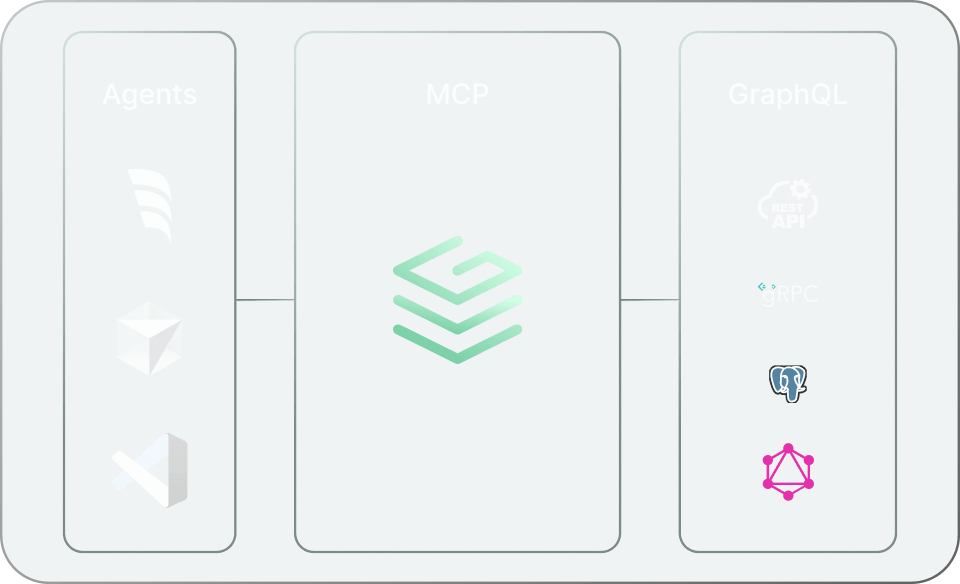
# Gateway - MCP
MCP is a new protocol, launched in November 2024 by [Anthropic](https://anthropic.com), designed to make structured data explorable and actionable via natural language. Grafbase offers MCP support out of the box - removing the need to stand up your own standalone MCP server, configure authentication, or fine-tune access control.
## Get started with Cursor
The Grafbase MCP server can be started with the [Grafbase CLI](/docs/cli/installation) by running:
```bash
npx grafbase mcp
```
The MCP server listens to requests at `http://127.0.0.1:5000/mcp` by default. To add it to Cursor, create a `.cursor/mcp.json` file in your project with the following:
```json
{
"mcpServers": {
"my-graphql-api": {
"url": "http://127.0.0.1:5000/mcp"
}
}
}
```
## Setting up MCP in the Grafbase Gateway
The [Grafbase Gateway](/docs/gateway/installation) can be configured to expose a MCP endpoint with the following `grafbase.toml` configuration:
```toml
[mcp]
enabled = true # defaults to false
# Path at which to expose the MCP service
path = "/mcp"
# Whether mutations can be executed
execute_mutations = false
---
# Gateway - Observability
The Grafbase Gateway lets you monitor gateway operations and errors through logs, traces, and metrics. When you use the gateway with a Grafbase access token, the Grafbase dashboard receives gateway operation analytics automatically.
The gateway also supports sending monitoring data to endpoints that implement [OpenTelemetry](https://opentelemetry.io/) protocols. You can combine gateway traces with other services in your platform, and access more metrics beyond what the Grafbase dashboard currently shows.
## Logs
The Grafbase Gateway provides logs for monitoring gateway operations and errors. By default, it outputs logs to standard output. Additionally, the gateway can send monitoring data to an endpoint that implements the [OpenTelemetry](https://opentelemetry.io/) protocols.
### Level of Produced Information
You can define the level of information by setting the log level command line argument:
```bash
--log
Set the logging level, this applies to all spans, logs and trace events.
Beware that *only* 'off', 'error', 'warn' and 'info' can be used safely in
production. More verbose levels, such as 'debug', will include sensitive
information like request variables, responses, etc.
Possible values are: 'off', 'error', 'warn', 'info', 'debug', 'trace' or a
custom string. In the last case, the string is passed on to
[`tracing_subscriber::EnvFilter`] as is and is only meant for debugging
purposes. No stability guarantee is made on the format.
[env: GRAFBASE_LOG=]
[default: info]
```
This setting affects both traces and logs. The default level is `info`. `debug` and `trace` will include sensitive details and should not be used in production.
The `error` or `off` levels affect all traces and spans at `info` level. If you want to silence all logs but still export them along with traces and metrics to an OpenTelemetry endpoint, direct standard output and standard error to `/dev/null`.
### System Logs
By default, the system outputs logs to standard output. Logs can appear in two different formats:
```bash
--log-style
Set the style of log output
[env: GRAFBASE_LOG_STYLE=]
[default: pretty]
Possible values:
- pretty: Pretty printed logs, used as the default in the terminal
- text: Standard text, used as the default when piping stdout to a file
- json: JSON objects
```
The default style is `pretty`, inside a terminal, which provides ANSI-colored text for terminal output and a human-friendly formatting. When piping to a file, `text` will be used instead.The `json` format delivers logs in JSON format, which can be useful if the logging platform supports structured data.
### Access Logs
The Grafbase Gateway can log access requests. Read more on the [access logs feature](/docs/gateway/security/access-logs) and configuring them in the [gateway configuration](/docs/gateway/configuration/gateway#access-logs).
### Logging into an OpenTelemetry Endpoint
The Grafbase Gateway can send logs to an OpenTelemetry endpoint. To enable this feature, either define the global telemetry endpoint or an endpoint for the logs exporter. Read more about the [OpenTelemetry configuration](/docs/gateway/configuration/telemetry#log-exporter).
## Traces
Grafbase Gateway monitors the request lifecycle by providing traces. Add a valid access token in the `GRAFBASE_ACCESS_TOKEN` environment variable to automatically send traces to the Grafbase Dashboard or Grafbase Enterprise platform.
The dashboard displays only traces from the Grafbase Gateway. Configure a different OpenTelemetry endpoint in the configuration file to send traces elsewhere. A third-party telemetry platform lets you [propagate traces](/docs/gateway/configuration/telemetry#propagation) from the gateway with other services in your platform. Traces provide information on the request lifecycle and send data to the OpenTelemetry endpoint from the `info` level.
Read more about the [telemetry configuration](/docs/gateway/configuration/telemetry) and [tracing spans and attributes](/docs/gateway/telemetry/tracing-attributes).
## Metrics
The Grafbase Gateway delivers metrics for requests and operations to an OpenTelemetry endpoint. Metrics include counters, histograms, and gauges at various points in the system.
To automatically send metrics to the Grafbase Dashboard or Grafbase Enterprise platform, add a valid access token in the `GRAFBASE_ACCESS_TOKEN` environment variable. [Configure an additional OpenTelemetry exporter](/docs/gateway/configuration/telemetry#metrics-exporter) in the configuration file to send metrics to other destinations.
The [metrics reference](/docs/gateway/telemetry/metrics-attributes) lists all metrics and their attributes.
---
# Gateway - Performance - Automatic Persisted Queries
Automatic Persisted Queries let you avoid sending the query string each time and help prepare the execution. By default, they are enabled in the Grafbase Gateway. You can [disable them from the configuration](/docs/gateway/configuration/automatic-persisted-queries).
First, associate a query with a unique identifier: the SHA-256 hash of the query string:
```text
# SHA-256
4ef8d269e7944ef2cd6554ecb3d73164546945cf935806933448905abec554e5
```
```graphql
query {
__typename
}
```
You can persist the query at any time. Send the following payload, and the system caches it for a day:
```json
{
"query": "query { __typename }",
"extensions": {
"persistedQuery": {
"version": 1,
"sha256Hash": "4ef8d269e7944ef2cd6554ecb3d73164546945cf935806933448905abec554e5"
}
}
}
```
The next time you execute the same query, omit the query field as follows:
```json
{
"extensions": {
"persistedQuery": {
"version": 1,
"sha256Hash": "4ef8d269e7944ef2cd6554ecb3d73164546945cf935806933448905abec554e5"
}
}
}
```
If Grafbase does not find the query, it returns the following error:
```json
{
"errors": [
{
"message": "Persisted query not found",
"extensions": {
"code": "PERSISTED_QUERY_NOT_FOUND"
}
}
]
}
```
In this case, send the request with the full query string.
## Using GET requests
Grafbase also supports executing GET HTTP requests. You must pass fields as query parameters, encoding their values in JSON format first. To execute a persisted query:
```bash
curl --get 'http://localhost:4000/graphql' \
--data-urlencode 'extensions={"persistedQuery":{"version":1,"sha256Hash":"4ef8d269e7944ef2cd6554ecb3d73164546945cf935806933448905abec554e5"}}'
```
To register a query:
```bash
curl --get 'http://localhost:4000/graphql' \
--data-urlencode 'query=query { __typename }' \
--data-urlencode 'extensions={"persistedQuery":{"version":1,"sha256Hash":"4ef8d269e7944ef2cd6554ecb3d73164546945cf935806933448905abec554e5"}}'
```
---
# Gateway - Performance - Entity Caching
Grafbase Gateway uses Entity Caching to cache requests to subgraphs. Enable entity caching globally in the [global entity cache config section](/docs/gateway/configuration/entity-cache). Every subgraph can define its own cache policies - learn more in the [per-subgraph entity cache config section](/docs/gateway/configuration/subgraph-configuration#entity-cache). The system protects user data by scoping cached data, and uses all headers to compute the scope.
Entity caching stores data in an in-memory cache by default. Configure Redis as your caching backend when you need to run and share cache across multiple gateways. Learn more about [configuring Redis for entity cache](/docs/gateway/configuration/entity-cache#using-redis-for-entity-caching).
TLS with Redis increases response times, and each request requires at least one call to the Redis server. Place the Redis server as close as possible to the gateway instances and avoid using TLS for the counters.
---
# Gateway - Performance - Compression
Grafbase Gateway supports compression for:
- the body of responses from the Gateway (using the standard `Accept-Encoding` header)
- the body of responses from subgraphs for requests issued by the Gateway (using the standard `Accept-Encoding` header)
All the common compression algorithms are supported: gzip, deflate, br (brotli) and zstd.
---
# Gateway - Security
Security is a critical aspect of any application. It is important to ensure that the application is secure and that the data is protected. This section will cover the security aspects of the application.
## Control the Operations with Trusted Documents
The application should control the operations that can be performed on the data. This can be done by using trusted documents that define the operations that can be performed on the data. The application should only allow the operations that are defined in the trusted documents.
Read more about [trusted documents](/docs/gateway/security/trusted-documents).
## Rate Limiting
Rate limiting is an important security measure that can help protect the application from abuse. It can help prevent malicious users from overwhelming the application with requests. Rate limiting can be implemented at various levels, such as the global operation level, or the per-subgraph level.
Read more about [rate limiting](/docs/gateway/security/rate-limiting).
## Operation Limits
Operation limits can help protect the application from abuse by limiting the cost of operations.
Read more about [operation limits](/docs/gateway/security/operation-limits).
## Authentication
Restrict access to your federated graph, authenticating users.
Read more about [authentication](/docs/gateway/security/authentication).
## Authorization
Restrict access to fields, objects, and more for a given operation.
Read more about [authorization](/docs/gateway/security/authorization).
## Access Logs
Access logs can help you monitor and track the activity on your federated graph. Grafbase Gateway provides a fully customizable logging system that allows you to log the requests and responses.
Read more about [access logs](/docs/gateway/security/access-logs).
## Access Tokens
Access tokens are used to authenticate users and grant them access to the federated graph. Access tokens can be used to control access to the federated graph and to protect the data.
Read more about [access logs](/docs/gateway/security/access-logs).
---
# Gateway - Security - Trusted Documents
GraphQL APIs provide clients with considerable flexibility to query any data they need. This flexibility represents one of GraphQL's major strengths, but it also introduces vulnerabilities. When any client can query any data, malicious or careless queries can create excessive load on the server. Trusted Documents solve this problem.
The concept has existed since the early days of GraphQL, using terms like _persisted queries_ or _persisted operations_. An API that uses Trusted Documents accepts only GraphQL documents (queries, operations) submitted (trusted) at development or deployment time. Instead of sending the whole document, clients send a more compact _document id_. This approach enhances security by rejecting malicious queries and improves performance by transmitting only the document id, similar to what occurs in [Automatic Persisted Queries](/docs/gateway/performance/automatic-persisted-queries).
## Overview
Adopting Trusted Documents places constraints primarily on API clients. To enforce trusted documents in a Grafbase API, you simply set a single option in `grafbase.toml` (see below).
We will begin by exploring the more complex aspects of adopting Trusted Documents and then explain how to enforce them.
## Trusting Documents: Upload a Manifest
The purpose of Trusted Documents is to accept only queries on an allow-list. Start by generating and communicating that list. We call the allow-list document a **manifest**, and it takes the form of a JSON file. Your GraphQL client setup of choice creates the manifest.
The two most common setups for generating a trusted documents manifest are [Relay Persisted Queries](https://relay.dev/docs/guides/persisted-queries/#local-persisted-queries) and Apollo Client operation manifests ([JS](https://www.apollographql.com/docs/react/api/link/persisted-queries/#1-generate-operation-manifests), [Kotlin](https://www.apollographql.com/docs/kotlin/advanced/persisted-queries/), [iOS](https://www.apollographql.com/docs/ios/fetching/persisted-queries/#2-generate-operation-manifest)). Grafbase natively supports both Relay and Apollo Client manifest formats. If you need support for another setup or manifest format, please [contact us](/contact).
After you create a manifest JSON file that includes the GraphQL documents your application needs and the associated document IDs, submit the manifest using the `grafbase` CLI:
```bash
grafbase trust my-account/my-graph@main --manifest manifest.json --client-name ios-client
```
Let's break down the arguments:
- `grafbase trust my-account/graph-name@main`: Like many other CLI commands, `trust` requires a graph reference in the format `/@`. Remember that you must include the branch name to avoid defaulting to the production branch, which can introduce security risks.
- `--manifest manifest.json`: Provide the file path to the JSON file generated by your client of choice.
- `--client-name`: Each client of an API using trusted documents must identify itself with a client name using the `x-grafbase-client-name` HTTP header. Read on for more details.
After you submit the manifest, the API trusts the GraphQL documents in the manifest, associating them with their corresponding document IDs. **The trust command applies to a single branch and a single client name**. To enforce trusted documents across multiple branches or clients, you must trust the relevant documents for each combination.
## Trusted Documents in the Client: Runtime Components
In the previous section, we uploaded the trusted document manifests. Now, our API knows which documents to expect. Our GraphQL client needs to change its requests to the API in two ways:
1. Send the `x-grafbase-client-name` header with the same name used when submitting the manifest with `grafbase trust`.
2. Send the trusted document IDs instead of the document body in GraphQL requests.
For example [in Relay](https://relay.dev/docs/guides/persisted-queries/#network-layer-changes):
```ts
function fetchQuery(operation, variables) {
return fetch('/graphql', {
method: 'POST',
headers: {
'content-type': 'application/json',
'x-grafbase-client-name': 'ios-app',
},
body: JSON.stringify({
// `doc_id` is also accepted.
documentId: operation.id, // NOTE: pass md5 hash to the server
// query: operation.text, // this is now obsolete because text is null
variables,
}),
}).then(response => {
return response.json()
})
}
```
or with [Apollo Client](https://www.apollographql.com/docs/react/api/link/persisted-queries/#persisted-queries-implementation):
```ts
import { ApolloClient, HttpLink, InMemoryCache } from '@apollo/client'
import { createPersistedQueryLink } from '@apollo/client/link/persisted-queries'
import { generatePersistedQueryIdsFromManifest } from '@apollo/persisted-query-lists'
const httpLink = new HttpLink({
uri: 'http://localhost:4000/graphql',
headers: {
'x-grafbase-client-name': 'ios-app',
},
})
const persistedQueryLink = createPersistedQueryLink(
generatePersistedQueryIdsFromManifest({
loadManifest: () => import('./path/to/persisted-query-manifest.json'),
}),
)
const client = new ApolloClient({
cache: new InMemoryCache(),
link: persistedQueriesLink.concat(httpLink),
})
```
## Enforcing Trusted Documents with the Self-hosted Grafbase Gateway
On the server side, the process is straightforward. You will find one relevant section in `grafbase.toml`:
```toml
[trusted_documents]
enabled = true
enforced = false
bypass_header_name = "my-header-name" # default null
bypass_header_value = "my-secret-is-{{ env.SECRET_HEADER_VALUE }}" # default null
```
See the [reference documentation](/docs/gateway/configuration/trusted-documents) for a list of all the options and their effects.
---
# Gateway - Security - Rate Limiting
The Grafbase Gateway offers ways to limit the number of requests per time window either globally or per subgraph. You can define the limit in memory per gateway instance or utilize a Redis backend to share the limit state with multiple gateway instances. Read more on [global rate limit configuration](/docs/gateway/configuration/gateway#rate-limit) and [per-subgraph rate limit configuration](/docs/gateway/configuration/subgraph-configuration#rate-limit).
## Using In-memory Rate Limiting
The default in-memory rate limiter uses the [generic cell rate algorithm](https://en.wikipedia.org/wiki/Generic_cell_rate_algorithm), which is a leaky bucket type scheduling algorithm. This method accurately limits sudden request bursts even before the current time window reaches its limit. It provides the fastest performance because the engine requires no network requests per GraphQL operation. When you restart the gateway with the in-memory rate limiter, the rate limit data starts empty.
## Using Redis for Rate Limiting
If you need to run multiple gateways and share the rate limit data with all of them, configure the gateway to use Redis as the rate limiter backend. Read more on [configuring Redis for rate limiting](/docs/gateway/configuration/gateway#using-redis-as-rate-limit-storage).
The Redis implementation uses an averaging fixed window rate limiting, which is different from the generic cell rate algorithm of the in-memory implementation. The Redis implementation generates two temporary keys to the database:
- `{key_prefix}:{subgraph:subgraph_name || global}:{current_time_bucket}`
- `{key_prefix}:{subgraph:subgraph_name || global}:{previous_time_bucket}`
The system fetches both values in a single Redis request, counts how far we are in the current time window, and calculates an averaged request count. The algorithm prevents spikes at the window border with an accuracy of a few percent.
Adding to the counter in the current time bucket happens off-thread, and the system deletes the buckets from the database after the time window ends.
The rate-limiting happens in a hot path, so the Redis server should be as close as possible to the gateway instances. Avoid using TLS for the counters to reduce the number of round trips to the Redis server.
---
# Gateway - Security - Operation Limits
One of the most common attacks malicious actors do to GraphQL APIs is sending complex and deeply nested queries to overload the server. Operation Limits allow you to protect your GraphQL API from these types of attacks. [Read more on configuring the operation limits](/docs/gateway/configuration/operation-limits).
## Depth
Limits the deepest nesting of selection sets in an operation, including fields in fragments.
Here's how depth is calculated:
```graphql
query GetProduct {
product(id: "123") {
# depth 1
title # depth 2
brand {
name # depth 3
}
}
}
```
To configure depth, add the following to your `grafbase.toml` file:
```toml
[operation_limits]
depth = 3
```
## Height
Limits the number of unique fields included in an operation, including fields of fragments. If a particular field is included multiple times via aliases, it's counted only once.
Here's how height is calculated:
```graphql
query GetProduct {
product(id: "123") {
# height 1
id # height 2
name # height 3
title: name # aliases don't count
}
}
```
To configure height, add the following to your `grafbase.toml` file:
```toml
[operation_limits]
height = 20
```
## Aliases
Limits the total number of aliased fields in an operation, including fields of fragments.
Here's how aliases are calculated:
```graphql
query GetProduct {
product(id: "123") {
title: name # alias 1
something: name # alias 2
else: name # alias 3
}
}
```
To configure aliases, add the following to your `grafbase.toml` file:
```toml
[operation_limits]
aliases = 10
```
## Root Fields
Limits the number of root fields in an operation, including root fields in fragments. If a particular root field is included multiple times via aliases, each usage is counted.
Here's how root fields are calculated:
```graphql
query GetProducts {
topBooks {
# root field 1
id
}
topMovies {
# root field 2
id
}
topGames {
# root field 3
id
}
}
```
To configure root fields, add the following to your `grafbase.toml` file:
```toml
[operation_limits]
root_fields = 10
```
## Complexity
Complexity takes the number of fields as well as the depth and any pagination arguments into account. Every scalar field adds 1 point, every nested field adds 2 points, and every pagination argument multiplies the nested objects score by the number of records fetched.
Here's how root fields are calculated:
```graphql
query {
# total: 18
products(limit: 2) {
# (Nested: 2 + 1 + 1 + 1 + (author: 2 + 1 + 1)) * limit: 2 = 18
id # scalar: 1
title # scalar: 1
price # scalar: 1
brand {
# nested: 4 (2 + 1 + 1)
id # scalar: 1
name # scalar: 1
}
}
}
```
To configure complexity, add the following to your `grafbase.toml` file:
```toml
[operation_limits]
complexity = 100
```
---
# Gateway - Security - Complexity control
GraphQL queries offer lots of flexiblity to build the queries you need. But
this flexibility can be abused, causing excess load on downstream servers.
[Operation limits][op-limits] allow users to set a high water mark on many of
the properties of a GraphQL query. But they are quite a blunt tool - not all
subgraphs have the same performance characteristics and even within a subgraph
not all fields neccesarily cause the same load.
That's where complexity control comes in: it allows you to set an overall
complexity limit in the Grafbase Gateway, but leaves the definition of how
complex each field is up to the developers of the subgraphs.
Read more on [configuring the complexity control][config].
## Configuring Complexity
It's up to each individual subgraph to define the compleixty of it's fields.
This can be acheived with two directives: `@cost` & `@listSize`
### Field Cost
The `@cost` directive is defined as such:
```graphql
directive @cost(
weight: Int!
) on ARGUMENT_DEFINITION | ENUM | FIELD_DEFINITION | INPUT_FIELD_DEFINITION | OBJECT | SCALAR
```
This directive can be provided on a field, argument, or type. When provided on
a field or argument it sets the cost of that field or argument appearing in a
query. When provided on a type it sets the cost of a field of that type
appearing in a query. If an individual field has a cost then that will be
override any cost set on the type of that field.
If no cost directive can be found for a particular field or it's type, then a
default cost will be applied. If the field is of a scalar type, then its cost
is assumed to be zero. If the field is of an object type, then its default
cost is 1.
### List Size
The `@listSize` directive is defined as such:
```graphql
directive @listSize(
assumedSize: Int
slicingArguments: [String!]
sizedFields: [String!]
requireOneSlicingArgument: Boolean = true
) on FIELD_DEFINITION
```
This directive controls the size that we assume each list field has. In brief
it's arguments are:
- `assumedSize` if provided sets the size that we assume this list is.
- `slicingArguments` says that the given arguments to this field define the
length of the list.
- `sizedFields` can be used on connection fields that are following the [GraphQL
cursor specification][cursor-spec] to indicate which subfields of the current
field are controlled by the slicing arguments on this field.
- `requireOneSlicingArgument` can be set when slicing arguments is also set.
If set an error will be raised if we receive a query for this field that
doesn't have exactly one slicing argument provided. This argument defaults
to true, but if slicingArguments is not provided it is not used.
For more details you can read the detailed specification of `@listSize` in the
[Cost Directive Specification][cost-spec].
## Complexity Calculation
The complexity score of an operation is calculated by walking the query, and
summing up the cost of each individual field. Fields are assigned a cost
according to the cost of the field or the type of the field, plus the cost of
all their children. If the field in question is a list then its cost is
multiplied by the expected size of the list.
For example this query would be calculated as:
```graphql
query {
# (self + children) * listSize = (1 + 1) * 4 = 8
products(limit: 4) {
id # scalar: 0
title # scalar: 0
price # scalar: 0
author {
# object: 1
id # scalar: 0
name # scalar: 0
}
}
}
```
[op-limits]: /docs/gateway/security/operation-limits
[cost-spec]: https://ibm.github.io/graphql-specs/cost-spec.html#sec-The-List-Size-Directive
[cursor-spec]: https://relay.dev/graphql/connections.htm
[config]: /docs/gateway/configuration/complexity-control
---
# Gateway - Security - Message Signatures
The Grafbase Gateway can sign subgraph HTTP requests following [RFC 9421][rfc9421]. Read more on [configuring message signatures][config].
## Keys
A key file should be provided in the config. This key file should be one of:
1. A JSON file containing a JWK.
2. A PEM file containing a PKCS#8 private key.
### Algorithms
We'll choose which algorithm to use based on the key file provided, but a
specific algoithm can be provided in the configuration.
The available algorithms are:
- `hmac-sha256`
- `ed25519`
- `ecdsa-p256-sha256`
- `ecdsa-p384-sha384`
If the provided key & algorithm don't match the gateway will refuse to start.
The algorithm you use for singing can have an impact on the latency of your
subgraph requests. The list above is in performance order, from most
performant to least performant. We recommend testing your chosen algorithm &
settings if this is a concern - a message signing span will be output in
tracing that can be used to determine the impact of your settings.
## Controlling Signing
The Grafbase Gateway allows you to control which parts of a subgrah request are
used as input to message signing. There are several settings for this:
- The `headers` key can control which headers are included or excluded. It has
two sub-keys:
1. `include` should be a list of headers to include in the signature.
If not present, all headers will be included.
2. `exclude` should be a list of headers to exclude from the signature.
This setting takes precedence over `include`
- The `derived_components` key allows you to control which "derived
components" are included. This defaults to `["request_target"]`. The
following options are available:
- `method` the HTTP method.
- `target_uri` the full URL of the request
- `authority` the hostname of the requests target URL
- `scheme` the scheme of the requests target URL
- `request_target` the [request target][request-target] of the request.
- `path` the absolute path of the request URL
- The `signature_parameters` key is a list of additional signature parameters
to include. It currently only has one setting:
- `nonce` can be provided to include a random nonce in every requests
signature.
- `expiry` can be set to a duration string. (e.g. `"30s"` for 30 seconds). If
provided, signatures will expire after this duration.
Here is an example of these settings:
[config]: /docs/gateway/configuration/message-signatures
[rfc9421]: https://datatracker.ietf.org/doc/html/rfc9421
[request-target]: https://datatracker.ietf.org/doc/html/rfc9421#name-request-target
---
# Gateway - Security - Authentication
Authentication extensions are available in the [Marketplace](/extensions):
- [JWT](/extensions/jwt): Validates a JWT token
You can learn how authentication extensions work and build your own with this follow along tutorial: [Customize your GraphQL Federation authentication and authorization with Grafbase Extensions](/blog/custom-authentication-and-authorization-in-graphql-federation).
A complete example can be found on [GitHub](https://github.com/grafbase/grafbase/tree/main/examples/authorization) and the [Grafbase SDK](https://docs.rs/grafbase-sdk/latest/grafbase_sdk/) is the extension reference.
---
Authorization extensions are available in the [Marketplace](/extensions):
- [Authenticated](/extensions/authenticated): Restrict access to unauthenticated clients.
- [Requires Scopes](/extensions/requires-scopes): Grant access only to clients with appropriate OAuth scopes.
You can learn how authorization extensions work and build your own with this follow along tutorial: [Customize your GraphQL Federation authentication and authorization with Grafbase Extensions](/blog/custom-authentication-and-authorization-in-graphql-federation).
A complete example can be found on [GitHub](https://github.com/grafbase/grafbase/tree/main/examples/authorization) and the [Grafbase SDK](https://docs.rs/grafbase-sdk/latest/grafbase_sdk/) is the extension reference.
---
# Gateway - Security - Access Logs
Track the activity of the Grafbase Gateway with access logs. These logs require custom configuration and definition through gateway hooks, unlike system logs. Collect data about request execution and response at three points in the request lifecycle: [after a subgraph request](https://docs.rs/grafbase-hooks/latest/grafbase_hooks/trait.Hooks.html#method.on_subgraph_response), [after an operation](https://docs.rs/grafbase-hooks/latest/grafbase_hooks/trait.Hooks.html#method.on_operation_response), and [right before sending a response to the user](https://docs.rs/grafbase-hooks/latest/grafbase_hooks/trait.Hooks.html#method.on_http_response).
First, check out our [hooks guide](/guides/implementing-gateway-hooks) to learn the basics of custom hook implementation.
## Usage
Enable access logs in the Gateway configuration:
```toml
[gateway.access_logs]
enabled = true
path = "/path/to/logs"
```
[Read more](/docs/gateway/configuration/gateway#access-logs) on configuration options.
With access logs enabled, invoking the [`host_io::access_log::send`](https://docs.rs/grafbase-hooks/latest/grafbase_hooks/host_io/access_log/fn.send.html) function will append the specified bytes to a file called `access.log` in the configured path.
The first two hooks can return a set of bytes. The return values of [`on_subgraph_response` hooks](https://docs.rs/grafbase-hooks/latest/grafbase_hooks/trait.Hooks.html#method.on_subgraph_response) appear in the [`ExecutedOperation`](https://docs.rs/grafbase-hooks/latest/grafbase_hooks/struct.ExecutedOperation.html#structfield.on_subgraph_response_outputs) of the [`on_operation_response` hook](https://docs.rs/grafbase-hooks/latest/grafbase_hooks/trait.Hooks.html#method.on_operation_response), and the outputs of `on_operation_response` hooks are in the [`ExecutedHttpRequest`](https://docs.rs/grafbase-hooks/latest/grafbase_hooks/struct.ExecutedHttpRequest.html#structfield.on_operation_response_outputs) of the [`on_http_response` hook](https://docs.rs/grafbase-hooks/latest/grafbase_hooks/trait.Hooks.html#method.on_http_response).
## Metrics
The [metrics counter](/docs/gateway/telemetry/metrics-attributes#pending-access-logs) `grafbase.gateway.access_log.pending` increments with each `log-access` call and decrements once the bytes are written to the `access.log`. Monitoring this value is crucial. Each `access_log::send` call consumes memory until data gets written, and the channel can hold a maximum of 128,000 messages. For the `blocking` access log method, a full channel will block all `access_log::send` calls, while the `non-blocking` method returns errors, sending data back to the caller.
## Implementing the Hooks in Rust
Use the [hooks guide](/guides/implementing-gateway-hooks) as the basis for the access logs implementation. The template project is a Rust project with the necessary dependencies and build instructions to compile the project.
The `Cargo.toml` file provides the dependencies and build instructions to compile the project:
```toml
[package]
name = "my-hooks"
version = "0.1.0"
edition = "2021"
license = "MIT"
[dependencies]
grafbase-hooks = { version = "*", features = ["derive"] }
[lib]
crate-type = ["cdylib"]
[profile.release]
codegen-units = 1
opt-level = "s"
debug = false
strip = true
lto = true
```
You need to implement all the response hooks:
```rust
use grafbase_hooks::{
grafbase_hooks, SharedContext, ExecutedHttpRequest,
ExecutedOperation, ExecutedSubgraphRequest, Hooks,
};
struct MyHooks;
#[grafbase_hooks]
impl Hooks for MyHooks {
fn new() -> Self
where
Self: Sized,
{
Self
}
fn on_subgraph_response(
&mut self,
context: SharedContext,
request: ExecutedSubgraphRequest
) -> Vec {
Vec::new()
}
fn on_operation_response(
&mut self,
context SharedContext,
operation: ExecutedOperation
) -> Vec {
Vec::new()
}
fn on_http_response(
&mut self,
context: SharedContext,
request: ExecutedHttpRequest
) { }
}
grafbase_hooks::register_hooks!(Component);
```
The implementation is the simplest possible and doesn't really do anything.
We start building the access log row in the subgraph response handler. By using the `postcard` and `serde` crates to (de-)serialize the data:
```rust
#[derive(serde::Serialize, serde::Deserialize)]
pub struct SubgraphInfo<'a> {
pub subgraph_name: &'a str,
pub method: &'a str,
pub url: &'a str,
pub has_errors: bool,
pub cached: bool,
}
#[derive(serde::Serialize, serde::Deserialize)]
pub struct OperationInfo<'a> {
pub name: Option<&'a str>,
pub document: &'a str,
pub subgraphs: Vec>,
}
#[derive(serde::Serialize, serde::Deserialize)]
pub struct AuditInfo<'a> {
pub method: &'a str,
pub url: &'a str,
pub status_code: u16,
pub operations: Vec>,
}
```
The first three hooks manage aggregation of the data, and the last hook writes the data to the log file:
```rust
#[grafbase_hooks]
impl Hooks for MyHooks {
fn new() -> Self
where
Self: Sized,
{
Self
}
fn on_subgraph_response(
&mut self,
_: SharedContext,
request: ExecutedSubgraphRequest
) -> Vec {
let info = SubgraphInfo {
subgraph_name: &request.subgraph_name,
method: &request.method,
url: &request.url,
has_errors: request.has_errors,
cached: matches!(request.cache_status, CacheStatus::Hit),
};
postcard::to_stdvec(&info).unwrap()
}
fn on_operation_response(
&mut self,
_: SharedContext,
operation: ExecutedOperation
) -> Vec {
let info = OperationInfo {
name: request.name.as_deref(),
document: &request.document,
subgraphs: request
.on_subgraph_response_outputs
.iter()
.filter_map(|bytes| postcard::from_bytes(bytes).ok())
.collect(),
};
postcard::to_stdvec(&info).unwrap()
}
fn on_http_response(
&mut self,
_: SharedContext,
request: ExecutedHttpRequest
) {
let info = AuditInfo {
method: &request.method,
url: &request.url,
status_code: request.status_code,
operations: request
.on_operation_response_outputs
.iter()
.filter_map(|bytes| postcard::from_bytes(bytes).ok())
.collect(),
};
grafbase_hooks::host_io::access_log::send(&serde_json::to_vec(&info).unwrap()).unwrap();
}
}
```
This code performs three main tasks:
1. Serializes information from each subgraph call into a `SubgraphInfo` struct.
2. Creates an `OperationInfo` struct from each operation call and combines related subgraph calls into it.
3. Builds an `AuditInfo` struct from each HTTP request and combines related operation calls into it.
The last hook calls the `access_log::send` method to serialize the final result to JSON, written to the access log.
The serialization of data can vary as long as it returns bytes. As an example, if your access.log contains JSON data, define structured data as [Serde](https://serde.rs/) structures in the hooks and serialize them into bytes using [serde_json](https://crates.io/crates/serde_json).
See a [full example project](https://github.com/grafbase/grafbase/tree/main/examples/access-logs) implementing access logs with Grafbase Gateway.
---
# Gateway - Security - Access Tokens
Access tokens grant access to Grafbase services and APIs. Use them to manage your account, organization, and graphs.
## Personal Access Tokens
Use personal access tokens to grant access for the [Grafbase CLI](/docs/grafbase-cli) and Management API.
### Scopes
Each access token has a specific scope that grants access to certain account and organization settings.
#### Full Access
Full access tokens manage all account and project settings for your personal account and any organizations you belong to.
#### Personal
These tokens manage only your own account and organization(s).
#### Organization
These tokens manage only the selected organization and its graphs. If you belong to multiple organizations, you will see them in the list of scopes.
### Create a Personal Access Token
Create access tokens from your [account settings > access tokens](https://app.grafbase.com/settings/access-tokens) page.
Give your access token a name and select a scope.
You cannot modify or read access tokens after creation. Copy the token to a secure location and never share it with anyone.
### Revoke Access Tokens
Tokens do not expire. Revoke them when you no longer need them.
Revoke tokens anytime from your [account settings > access tokens](https://app.grafbase.com/settings/access-tokens) page.
## Organization Access Tokens
Organization access tokens grant access for the Grafbase Gateway telemetry and Graph Delivery Network. These tokens belong to an organization, so they continue working even if you remove a user from the organization.
### Scopes
Each access token has a specific scope that grants access to certain organization and graph settings.
#### All Graphs
All Graphs tokens let you use the Grafbase Gateway to access all graphs within the organization.
#### Specific Graphs
Use these tokens to limit the Grafbase Gateway to access only certain graphs.
### Create an Organization Access Token
Create access tokens from your `organization settings > access tokens` page.
Give your access token a name and select the graph(s).
You cannot modify or read access tokens after creation. Copy the token to a secure location and never share it with anyone.
### Revoke Access Tokens
Tokens do not expire. Revoke them when you no longer need them.
Revoke tokens anytime from your `organization settings > access tokens` page.
---
# Gateway - Arguments
The Grafbase Gateway accepts command line arguments to configure its operations. Specify the gateway's behavior using these arguments. Run `grafbase-gateway --help` to see all available options.
## Listen Address
**Argument**: `-l, --listen-address `
The IPv4 or IPv6 address and port to listen on. Default is `127.0.0.1:5000`.
## Graph Ref
**Argument**: `-g, --graph-ref `
The graph reference to fetch from the Grafbase API, following the format `graph@branch`. Branch can be omitted to use the production branch. The gateway checks for graph changes every ten seconds. Cannot be used with the `--schema` option.
## Schema
**Argument**: `-s, --schema `
The path to the federated schema file. Use this option to run the gateway in air-gapped mode. Cannot be used with the `--graph-ref` option.
The gateway checks for schema changes every five seconds. If the file changes, it reloads the file, creates a new engine; and if configured, warms the operation cache.
## Config
**Argument**: `-c, --config `
The path to the TOML configuration file.
## Log Level
**Argument**: `--log `
Sets the logging level and controls the detail for all spans, logs and trace events.
In production, use only `off`, `error`, `warn`, and `info` levels. More verbose levels like `debug` include sensitive information such as request variables and responses.
Setting the level to `off` or `error` prevents the gateway from sending traces to the OpenTelemetry collector.
You can use these values: `off`, `error`, `warn`, `info`, `debug`, `trace`, or a custom string. Custom strings pass directly to [`tracing_subscriber::EnvFilter`] for debugging only. Grafbase makes no guarantees about the format stability.
The default level is `info`.
## Log Style
**Argument**: `--log-style `
Select a log style format for the gateway. Choose `pretty` for human-readable logs, `json` for machine-readable logs, or `text` for black and white logs when you pipe standard output to a file. Grafbase uses `pretty` as the default style.
## Hot Reload
**Argument**: `--hot-reload`
Enables hot reloading of the gateway configuration. This option applies to configuration sections that can change without a gateway restart.
## Help
**Argument**: `-h, --help`
## Version
**Argument**: `-V, --version`
---
# Gateway - Configuration - Authentication
## Default behavior
The default behavior of the gateway depends on whether any authentication is configured or not. When there isn't, the gateway will provide an anonymous token for each request.
On the other hand, if there is, whether it's an extension or the deprecated embedded jwt, the gateway will deny access if the user could not be authenticated.
This can be controlled with the following:
```toml
[authentication]
# If the client could not be authenticated
# Deny access
default = "deny"
# or grant an anonymous token
defualt = "anonymous"
```
## Extensions
Authentication extensions are available in the [Marketplace](/extensions):
- [JWT](/extensions/jwt): Validates a JWT token
You can learn how authentication extensions work and build your own with this follow along tutorial: [Customize your GraphQL Federation authentication and authorization with Grafbase Extensions](/blog/custom-authentication-and-authorization-in-graphql-federation).
A complete example can be found on [GitHub](https://github.com/grafbase/grafbase/tree/main/examples/authorization) and the [Grafbase SDK](https://docs.rs/grafbase-sdk/latest/grafbase_sdk/) is the extension reference.
## Deprecated embedded JWT
The Grafbase Gateway has an embedded JWT authentication implementation, with the same configuration as the [JWT](/extensions/jwt) extension.
```toml
[[authentication.providers]]
[authentication.providers.jwt]
name = "my-authenticator"
[authentication.providers.jwt.jwks]
url = "https://example.com/.well-known/jwks.json"
issuer = "example.com"
audience = "my-project"
poll_interval = 60
[authentication.providers.jwt.header]
name = "Authorization"
value_prefix = "Bearer "
```
- The `name` field specifies the name of the authenticator.
- The `jwks` section specifies the URL of the JWKS endpoint, the issuer, and the audience. The audience can be an array, in which case any audience in the JWT must match any of the audiences in the array. The `poll_interval` specifies how often the JWKS endpoint should be polled for updates.
- The `header` section specifies the header name and value prefix for the JWT token.
The `poll_interval` field is a [duration](/docs/gateway/configuration/durations).
Read more about [JWT authentication](/docs/gateway/security/jwt-authentication).
---
# Gateway - Configuration - Automatic Persisted Queries
```toml
[apq]
enabled = true
```
- `enabled`: Enables automatic persisted queries. Defaults to `true`.
Read more about [automatic persisted queries](/docs/gateway/performance/automatic-persisted-queries).
---
# Gateway - Configuration - Cross-Origin Resource Sharing
Configure CORS to prevent unauthorized browser requests.
```toml
[cors]
allow_credentials = false
allow_origins = "https://app.grafbase.com"
max_age = "60s"
allow_methods = ["GET", "POST"]
allow_headers = "Content-Type"
expose_headers = ["Access-Control-Allow-Origin"]
allow_private_network = false
```
- `allow_credentials`: Enables or disables credential sending. Defaults to `false`.
- `allow_origins`: Allowed domains, one or multiple domains in a list. A Glob pattern can also be used. To accept any domain, use `"*"`. Defaults to no domains if CORS is enabled.
- `max_age` ([duration](/docs/gateway/configuration/durations)): Duration for caching preflight `OPTIONS` request results. Default: none.
- `allow_methods`: One or multiple allowed HTTP methods. To accept any method, use `"*"`. Defaults to none if CORS is enabled.
- `allow_headers`: One or multiple allowed headers. To accept any header, use `"*"`. Defaults to no headers if CORS is enabled.
- `expose_headers`: Headers a preflight request can return to the client. Default: no headers if CORS is enabled.
- `allow_private_network`: Allows private network requests. Defaults to `false`.
The supported glob patterns for `allow_origins` are:
- `*` matches zero or more characters.
- `?` matches any single character.
- `[ab]` matches one of the characters contained in the brackets. Use `[!ab]` to match any character except `a` and `b`.
- `{p1,p2}` matches either pattern `p1` or `p2`.
For example `*.example.com` will match all sub-domains of `example.com`.
---
# Gateway - Configuration - Cross-Site Request Forgery Prevention
Enable CSRF protection if the graph is accessible over the internet with a browser.
If enabled, you must provide a special header `x-grafbase-csrf-protection: 1` in every request not `OPTIONS`. The server returns `403 Forbidden` if the header is not found.
```toml
[csrf]
enabled = true
```
- `enabled`: Enables CSRF protection. Defaults to `false`.
---
# Gateway - Configuration - Complexity Control
```toml
[complexity_control]
mode = "enforce"
limit = 10000
list_size = 100
```
- `mode` enables complexity control. Choose one of two values:
- `enforce` calculates the complexity of all queries and rejects incoming
requests that exceed the configured limit.
- `measure` calculates the complexity of all queries but only reports the
complexity
- `limit` sets the complexity limit for incoming queries (when mode is
`enforce`).
- `list_size` sets the default assumed size of lists in queries when their
associated field does not have a `@listSize` directive.
Read more about [complexity control](/docs/gateway/security/complexity-control).
---
# Gateway - Configuration - Durations
Many values in the configuration represent a duration. The format used in the Grafbase Gateway is inherited from the [duration_str](https://docs.rs/duration-str/0.12.0/duration_str/) crate.
The duration strings are composed of a number followed by a unit. The supported units are:
- y:Year. Support string value: [“y” | “year” | “Y” | “YEAR” | “Year”]. e.g. 1y
- mon:Month.Support string value: [“mon” | “MON” | “Month” | “month” | “MONTH”]. e.g. 1mon
- w:Week.Support string value: [“w” | “W” | “Week” | “WEEK” | “week”]. e.g. 1w
- d:Day.Support string value: [“d” | “D” | “Day” | “DAY” | “day”]. e.g. 1d
- h:Hour.Support string value: [“h” | “H” | “hr” | “Hour” | “HOUR” | “hour”]. e.g. 1h
- m:Minute.Support string value: [“m” | “M” | “Minute” | “MINUTE” | “minute” | “min” | “MIN”]. e.g. 1m
- s:Second.Support string value: [“s” | “S” | “Second” | “SECOND” | “second” | “sec” | “SEC”]. e.g. 1s
- ms:Millisecond.Support string value: [“ms” | “MS” | “Millisecond” | “MilliSecond” | “MILLISECOND” | “millisecond” | “mSEC” ]. e.g. 1ms
- µs:Microsecond.Support string value: [“µs” | “µS” | “µsecond” | “us” | “uS” | “usecond” | “Microsecond” | “MicroSecond” | “MICROSECOND” | “microsecond” | “µSEC”]. e.g. 1µs
- ns:Nanosecond.Support string value: [“ns” | “NS” | “Nanosecond” | “NanoSecond” | “NANOSECOND” | “nanosecond” | “nSEC”]. e.g. 1ns
This list is taken from the [duration_str docs](https://docs.rs/duration-str/0.12.0/duration_str/).
## Examples
- "1s": one second.
- "200.5ms": 200.5 milliseconds.
- "5d": 5 days.
---
# Gateway - Configuration - Entity Cache
Use the Grafbase Gateway entity caching to cache requests to subgraphs. Enable global caching in the `entity_caching` configuration section:
```toml
[entity_caching]
enabled = true
ttl = "60s"
storage = "memory"
```
- `enabled`: Enables or disables entity caching. Defaults to `false`.
- `ttl`: Time-to-live for cached entities. Defaults to `60s`.
- `storage`: Storage backend for entity caching. Supported values: `memory`, `redis`. Defaults to `memory`.
The system scopes cached data to prevent data leaks between users. The gateway uses all headers sent to the subgraph to compute the scope.
## Using Redis for Entity Caching
Entity caching stores data in an in-memory cache by default. To share cached data across multiple gateways, use Redis as the caching backend.
```toml
[entity_caching.redis]
url = "redis://localhost:6379"
key_prefix = "my_gateway"
```
- `url`: Redis endpoint URL. Use `redis://` for plain text protocol or `rediss://` for TLS connections. Defaults to `redis://localhost:6379`.
- `key_prefix`: String prefix for Redis cache keys. Defaults to `grafbase-cache`.
To use a TLS connection, start the Redis URL with `rediss://`. Add paths to these files in the TLS configuration if you don't have the server CA certificate in your system certificates or if you want to use mTLS.
```toml
[entity_caching.redis.tls]
cert = "/path/to/user.crt"
key = "/path/to/user.key"
ca = "/path/to/ca.crt"
```
- `cert`: The path to the mTLS user certificate file.
- `key`: The path to the mTLS user private key file. Must be defined together with the `cert`.
- `ca`: The path to the server CA certificate file.
Save files in PEM format. You don't need the `cert` and `key` unless your server uses mTLS. You don't need the `ca` if you've added the certificate to system certificate storage. The TLS library accepts only version 3 certificates and TLS version 1.3.
---
# Gateway - Configuration - Gateway
Set gateway server settings in this section:
```toml
[gateway]
timeout = "30s"
subgraph_timeout = "4s"
```
- `timeout` ([duration](/docs/gateway/configuration/durations)): Timeout for slow requests and responses. Default: `30s`.
- `subgraph_timeout` ([duration](/docs/gateway/configuration/durations)): A global timeout for all subgraph requests. A subgraph [can override](/docs/gateway/configuration/subgraph-configuration) this setting.
## Query Batching
Configure query batching in the Grafbase Gateway. When you use a large batch of queries, you risk causing a denial of service attack on your subgraph service or gateway.
```toml
[gateway.batching]
enabled = true
limit = 5
```
- `enabled`: Enables query batching. Defaults to `false`.
- `limit`: The maximum number of queries in a batch. If not set, the gateway does not limit the number of queries in a batch.
## Retries
Use retry configuration to specify how to handle subgraph request failures. A subgraph request can fail when the service times out, returns an error code, or reaches its rate limit.
```toml
[gateway.retry]
enabled = true
min_per_second = 10
ttl = "1s"
retry_percent = 0.1
retry_mutations = false
```
The gateway uses budget logic for retries. A successful subgraph request adds to the budget, while a failing request uses budget capacity.
- `enabled`: Enables retries for the given subgraph. Defaults to `false`.
- `min_per_second`: How many retries are available per second, at a minimum. Defaults to `10`.
- `ttl` ([duration](/docs/gateway/configuration/durations)): Each successful request to the subgraph adds to the retry budget. This setting controls how long the budget remembers successful requests. Defaults to `10s`.
- `retry_percent`: The fraction of the successful requests budget that can be used for retries. Defaults to `0.2`.
- `retry_mutations`: Whether mutations should be retried at all. Enable this setting only if mutations are idempotent. Defaults to `false`.
When you enable subgraph retries, the gateway executes them with an exponential backoff. The gateway performs the first retry after 100 milliseconds, the second after 200 milliseconds, the third after 400 milliseconds, and so on. The engine adds jitter to the times to prevent the thundering herd problem where too many requests reach the subgraph simultaneously. The gateway applies a jitter multiplier between 0.0 to 2.0 to the retry backoff.
## Access Logs
Read more about [access logs](/docs/gateway/security/access-logs) to implement the required hooks.
```toml
[gateway.access_logs]
enabled = true
path = "/path/to/logs"
rotate = "daily"
mode = "blocking"
```
- `enabled`: Enables the access log writer.
- `path`: Specifies the log directory.
- `rotate`: Defines a rotation strategy, after which a new log file is created, and the previous one gets archived; options include `never`, `minutely`, `hourly`, or `daily`.
- `rotate.size`: Defines a size-based rotation strategy. The value is in bytes; the log file rotates when it reaches or exceeds this limit.
- `mode`: Specifies how the system behaves when the log queue is full and the writer can't write to the file quickly enough. Options include `blocking`, which blocks the caller, or `non_blocking`, which returns an error while sending the data back to the caller.
The system names the current log file `access.log` and saves it to the path you specify. When you enable rotation, the system maintains `access.log` as the current file and adds timestamp suffixes to archived files. The timestamp indicates when the logger begins writing to each file.
---
# Gateway - Configuration - Graph
```toml
[graph]
path = "/graphql"
websocket_path = "/ws"
introspection = false
```
- `path` (optional): Specifies the URL path that hosts the GraphQL API. Defaults to `/graphql`.
- `websocket_path` (optional): Specifies the URL path of the Websocket endpoint, for subscriptions. Defaults to `/ws`.
- `introspection`: Enable or disable GraphQL introspection. The default value is `false`.
---
# Gateway - Configuration - MCP
Be aware that when enabled, this endpoint does not require any authentication.
Tools can be called by anyone. However, GraphQL requests still go through any
configured authentication & authorization. Furthermore there is no header
forwarding of any form, so any headers your subgraph expect should be
hardcoded with a [header
rule](/docs/gateway/configuration/header-rules).
The gateway can start an MCP server endpoint with:
```toml
[mcp]
enabled = true # defaults to false
# Path at which to expose the MCP service
path = "/mcp"
# Whether mutations can be executed
execute_mutations = false
# Either "http-streaming" or "sse". The default is "http-streaming".
transport = "http-streaming"
```
---
# Gateway - Configuration - Header Rules
Define header rules and execute them in order. The gateway uses `forward`, `insert`, `rename_duplicate` or `remove` rules to manage headers for subgraphs:
```toml
[[headers]]
rule = "forward"
name = "authorization"
[[headers]]
rule = "forward"
name = "x-custom-header"
rename = "y-custom-header"
[[headers]]
rule = "forward"
name = "x-possible-empty"
default = "default-value"
```
Forward multiple headers by using a [regular expression](https://docs.rs/regex/latest/regex/#syntax).
The engine matches headers in lowercase. Write your regular expression in lowercase, or [add a flag](https://docs.rs/regex/latest/regex/#grouping-and-flags) to match both lowercase and uppercase letters.
```toml
[[headers]]
rule = "forward"
pattern = "^x-custom*"
```
Use the `insert` rule to add header values:
```toml
[[headers]]
rule = "insert"
name = "authorization"
value = "Bearer secret-token"
```
Insert header values from environment variables:
```toml
[[headers]]
rule = "insert"
name = "authorization"
value = "Bearer {{ env.AUTHORIZATION_TOKEN }}"
```
Use the `remove` rule to block header forwarding for headers that match patterns:
```toml
[[headers]]
rule = "remove"
name = "x-custom-secret"
```
The `rename_duplicate` rule forwards the defined header value and copies the value with the specified rename to the subgraphs.
```toml
[[headers]]
rule = "rename_duplicate"
name = "x-custom-value"
default = "the value was missing"
rename = "y-custom-value"
```
The gateway forwards two headers to the subgraph with the same value - one named `x-custom-value` and one named `y-custom-value`. When a request is missing the `x-custom-value` header, and you define a `default` value, the gateway creates both headers using that default value. If you omit the default, the gateway doesn't forward the header or create a duplicate.
These headers don't use header rules:
- `Accept`
- `Accept-Charset`
- `Accept-Encoding`
- `Accept-Ranges`
- `Connection`
- `Content-Length`
- `Content-Type`
- `Keep-Alive`
- `Proxy-Authenticate`
- `Proxy-Authorization`
- `TE`
- `Trailer`
- `Transfer-Encoding`
- `Upgrade`
---
# Gateway - Configuration - Health Checks
Configure a health check endpoint in the gateway:
```toml
[health]
enabled = true
listen = "0.0.0.0:9668"
path = "/health"
```
- `enabled`: Enables or disables the health check endpoint. Default value is `true`.
- `path`: Sets the request path for the endpoint. Default value is `"/health"`.
- `listen`: Sets the address and port for health requests. Uses the main GraphQL endpoint's socket and port if not specified.
The health check endpoint sends a status code 200 with a body of `{"status": "healthy"}` when the gateway runs in a healthy state. The service returns a 503 status code when it detects an unhealthy gateway state.
The `tls` configuration settings in your configuration apply to the health check endpoint.
---
# Gateway - Configuration - Hooks
Deploy the Grafbase Gateway together with the WASM file that contains the code for your custom hooks.
```toml
[hooks]
location = "path/to/custom.component.wasm"
networking = false
stdout = false
stderr = false
environment_variables = false
max_pool_size = 1000
```
- `location` specifies the path to the WASM file that contains custom hooks. You must provide a valid path and have read access to the file.
- `networking` enables network access with TCP and UDP sockets, name resolution and WASI HTTP bindings to the guest. TCP and UDP sockets work only if the guest language supports WASI preview 2 standard. Default value is false.
- `stdout` enables the guest to write to the standard output stream. Default value is `false`.
- `stderr` enables the guest to write to the standard error stream. Default value is `false`.
- `environment_variables` copies host environment variables to the guest. Default value is `false`.
- `max_pool_size` specifies the number of hook instances that can run concurrently. Default value is four times the number of CPU cores.
## Pre-opened Directries
Define one or more pre-opened directories to enable file system access for guests:
```toml
[[hooks.preopened_directories]]
host_path = "/path/in/host/filesystem"
guest_path = "/path/in/guest/filesystem"
read_permission = true
write_permission = true
```
- `host_path` specifies an existing directory in the host filesystem. Give the user executing the Grafbase Gateway binary access to this directory.
- `guest_path` defines the path visible in the guest. Set this virtual path to any value. The guest uses this path to access the filesystem.
- `read_permission` allows reading all files and directories from the specified `host_path`.
- `write_permission` allows creating and modifying files and directories in the specified `host_path`.
---
# Gateway - Configuration - Extensions
Extensions are additional WASM modules that you can load into the gateway. To load an extension from the Grafbase extension repository, add it to the configuration with its name as the key, and the version requirement as the value. The version requirement follows [the Cargo specification](https://doc.rust-lang.org/cargo/reference/specifying-dependencies.html).
```toml
[extensions]
rest = "0.1"
```
You can also use the extended extension definition:
```toml
[extensions.rest]
version = "0.1"
path = "/path/to/build"
networking = false
stdout = false
stderr = false
environment_variables = false
max_pool_size = 1000
```
- `version` defines a [version requirement](https://doc.rust-lang.org/cargo/reference/specifying-dependencies.html)
- `path` runs the extension from a predefined path in the filesystem. The path must contain valid `extension.wasm` and `manifest.json` files.
- `networking` enables network access with TCP and UDP sockets, name resolution and WASI HTTP bindings to the guest.
- `stdout` enables the guest to write to the standard output stream. Default value is `false`.
- `stderr` enables the guest to write to the standard error stream. Default value is `false`.
- `environment_variables` copies host environment variables to the guest. Default value is `false`.
- `max_pool_size` specifies the number of extension instances that can run concurrently. Default value is four times the number of CPU cores.
---
# Gateway - Configuration - Message Signatures
Message signatures can be defined globally or [per-subgraph](#per-subgraph-message-signatures).
```toml
[gateway.message_signatures]
enabled = true
key.file = "key.json"
key.id = "my-key"
algorithm = "ed25519"
headers.include = ["content-type", "content-length"]
headers.exclude = ["authorization"]
derived_components = ["method", "target_uri"]
signature_parameters = ["nonce"]
expiry = "10s"
```
- `enabled`: Enables or disables message signatures. Default value is `false`.
- `key.file`: Specifies the path to the JSON file that contains the key pair. The file should either be a JSON file containing a JWK, or a PEM file containing a PKCS#8 private key.
- `key.id`: Specifies the key ID, which will be included as a signature parameter when signing. If possible this ID will be determined from the provided key file, but it can also be set anually.
- `algorithm`: Specifies the algorithm used for signing. Possible values are `ed25519`, `hmac-sha256`, `ecdsa-p256-sha256`, and `ecdsa-p384-sha384`. Default is the algorithm on the key file rovided.
- `headers.include`: Specifies the headers that should be included in the signature. Defaults to all headers being included.
- `headers.exclude`: Specifies the headers that should be excluded from the signature. This setting takes precedence over `include`. Defaults to no headers being excluded.
- `derived_components`: Specifies the components that should be included in the signature. Possible values are the HTTP method (`method`), the full URL of the request (`target_uri`), the ostname of the requests target URL (`authority`), the scheme of the requests target URL (`scheme`), the [request-target](https://datatracker.ietf.org/doc/html/rfc9421#name-request-target) of he request (`request_target`), and the absolute path of the request URL (`path`). Defaults value is `["request_target"]`.
- `signature_parameters`: Specifies the parameters that should be included in the signature. Currently the only possible value is `nonce`, which includes a random nonce in every requests ignature. Defaults to `[]`.
- `expiry` ([duration](/docs/gateway/configuration/durations)): Specifies the duration after which a signature is considered expired. Defaults to no expiry.
Read more about [Message Signatures](/docs/gateway/security/message-signatures).
---
# Gateway - Configuration - Network
```toml
[network]
listen_address = "127.0.0.1:5000"
```
- `listen_address`: Specify the address that the server binds to. The server defaults to `127.0.0.1:5000`. Configure this setting in the configuration file or specify it through the command line interface with the `--listen-address` argument.
---
# Gateway - Configuration - Operation Limits
```toml
[operation_limits]
depth = 10
height = 12
aliases = 5
root_fields = 6
complexity = 2
```
- `depth`: The maximum depth of the query.
- `height`: The maximum height of the query.
- `aliases`: The maximum number of aliases in the query.
- `root_fields`: The maximum number of root fields in the query.
- `complexity`: The maximum complexity of the query.
Read more about [Operation Limits](/docs/gateway/security/operation-limits).
---
# Gateway - Configuration - Operation Caching
The Grafbase Gateway maintains cached operation plans for unique operations to speed up consecutive requests with the same operation.
```toml
[operation_caching]
enabled = true
limit = 1000
warm_on_reload = false
warming_percent = 100
```
- `enabled`: Enables operation caching. Defaults to `true`.
- `limit`: The maximum number of operation plans to cache. Defaults to `1000`.
- `warm_on_reload`: If set to true, operations cached in memory will be
re-planned and stored in the cache prior to a schema reload.
- `warming_percent`: The percentage of the cache that should be warmed, if
`warm_on_reload` is set. Defaults to 100.
## Using Redis for Operation Caching
Operation caching stores data in an in-memory cache by default. To share cached data across multiple gateways, use Redis as the caching backend. Note that calling redis may be slower than replanning many operations, so be sure to test latency with your expected workload before enabling this.
```toml
[operation_caching.redis]
url = "redis://localhost:6379"
key_prefix = "my_gateway"
```
- `url`: Redis endpoint URL. Use `redis://` for plain text protocol or `rediss://` for TLS connections. Defaults to `redis://localhost:6379`.
- `key_prefix`: String prefix for Redis cache keys. Defaults to `grafbase-operation-cache`.
To use a TLS connection, start the Redis URL with `rediss://`. Add paths to these files in the TLS configuration if you don't have the server CA certificate in your system certificates or if you want to use mTLS.
```toml
[operation_caching.redis.tls]
cert = "/path/to/user.crt"
key = "/path/to/user.key"
ca = "/path/to/ca.crt"
```
- `cert`: The path to the mTLS user certificate file.
- `key`: The path to the mTLS user private key file. Must be defined together with the `cert`.
- `ca`: The path to the server CA certificate file.
Save files in PEM format. You don't need the `cert` and `key` unless your server uses mTLS. You don't need the `ca` if you've added the certificate to system certificate storage. The TLS library accepts only version 3 certificates and TLS version 1.3.
---
# Gateway - Configuration - Rate Limits
The Grafbase Gateway offers ways to limit the number of requests per time window either globally or per subgraph. You can define the limit in memory per gateway instance or utilize a Redis backend to share the limit state with multiple gateway instances.
## Limits
Set global rate limits for all subgraphs:
```toml
[gateway.rate_limit.global]
limit = 100
duration = "10s"
```
- `limit`: Maximum number of requests allowed in the duration.
- `duration` ([duration](/docs/reference/gateway/configuration/durations)): Time window for the limit.
Subgraph-specific rate limits can also be set with the following:
```toml
# For the 'products' subgraph
[subgraphs.products.rate_limit]
limit = 100
duration = "10s"
```
## Storage
If you need to run multiple gateways and share the rate limit data with all of them, configure the gateway to use Redis as the rate limiter backend.
```toml
[gateway.rate_limit]
storage = "memory"
```
- `storage`: Rate limit storage backend. Supported values: `memory`, `redis`.
### In-memory
The default in-memory rate limiter uses the generic cell rate algorithm. It's a leaky bucket type scheduling algorithm. This method accurately limits sudden request bursts even before the current time window reaches its limit. It provides the fastest performance because the engine requires no network requests per GraphQL operation. When you restart the gateway with the in-memory rate limiter, the rate limit data starts empty.
### Redis
The Redis implementation uses an averaging fixed window rate limiting, which is different from the generic cell rate algorithm of the in-memory implementation. The Redis implementation generates two temporary keys to the database:
```
{key_prefix}:{subgraph:subgraph_name || global}:{current_time_bucket}
{key_prefix}:{subgraph:subgraph_name || global}:{previous_time_bucket}
```
The system fetches both values in a single Redis request, counts how far we are in the current time window, and calculates an averaged request count. The algorithm prevents spikes at the window border with an accuracy of a few percent.
Adding to the counter in the current time bucket happens off-thread, and the system deletes the buckets from the database after the time window ends.
The rate-limiting happens in a hot path, so the Redis server should be as close as possible to the gateway instances. Avoid using TLS for the counters to reduce the number of round trips to the Redis server.
```toml
[gateway.rate_limit.redis]
url = "redis://localhost:6379"
key_prefix = "my_gateway"
```
- `url`: Redis server URL.
- `key_prefix`: Prefix for the rate limit keys.
To connect using TLS, the Redis URL must start with `rediss://`. If the server CA certificate is not in the system certificates or if you want to use mTLS, define paths to these files in the TLS configuration.
```toml
[gateway.rate_limit.redis.tls]
cert = "/path/to/user.crt"
key = "/path/to/user.key"
ca = "/path/to/ca.crt"
```
- `cert`: Path to the client certificate.
- `key`: Path to the client key.
- `ca`: Path to the CA certificate.
---
# Gateway - Configuration - Subgraph Configuration
Define settings per subgraph to add to or override global settings.
```toml
[subgraphs.products]
url = "https://example.com/graphql"
websocket_url = "https://example.com/"
subscriptions_protocol = "websocket"
timeout = "4s"
```
- `url`: Set the GraphQL endpoint for the subgraph to override the schema endpoint.
- `websocket_url`: Specifies the WebSocket URL that a subgraph uses when it differs from the GraphQL endpoint.
- `subscriptions_protocol` (optional, either "websocket" or "server_sent_events"): The protocol used by the gateway to communicate with the subgraph for subscriptions. If this option is not set, the gateway will default to websockets if `websocket_url` is defined, and server-sent events otherwise.
- `timeout`: The timeout for the subgraph.
## Entity Cache
Configure different settings per subgraph:
```toml
[subgraphs.products.entity_caching]
enabled = true
ttl = "60s"
```
- `enabled`: Enables or disables entity caching for the subgraph. Default value is the global setting.
- `ttl`: Sets the time-to-live for the cache. Default value is the global setting.
Read more on [global entity cache](/docs/gateway/configuration/entity-cache).
## Header Rules
Define header rules per subgraph. They execute after the global rules.
```toml
[[subgraphs.products.headers]]
rule = "forward"
name = "content-type"
```
For more information about available options, see [global header rules](/docs/gateway/configuration/header-rules).
## Rate Limit
Define custom rate limits for each subgraph and let the gateway check them before it sends requests. For more information, see [rate limiting](/docs/gateway/security/rate-limiting). You can hot-reload the subgraph rate limit and duration settings.
```toml
[subgraphs.products.rate_limit]
limit = 100
duration = "10s"
```
For more information about available options, see [global rate limit configuration](/docs/gateway/configuration/gateway#rate-limit).
## Retries
You can override the retry budget for the specific subgraph.
```toml
[subgraphs.products.retry]
enabled = true
min_per_second = 10
ttl = "1s"
retry_percent = 0.1
retry_mutations = false
```
For more information about available options, see [global retries configuration](/docs/gateway/configuration/gateway#retries).
## Mutual TLS (mTLS)
Enable mutual TLS (mTLS) authentication for a specific subgraph:
```toml
[subgraphs.products.mtls]
root.certificate = "/path/to/ca.pem"
root.is_bundle = false
identity = "/path/to/ca.pem"
allow_invalid_certs = false
```
- `root.certificate`: Path to either a root CA certificate or a certificate bundle
- `root.is_bundle`: Specify `true` when using a certificate bundle
- `identity`: Client identity file containing both PEM certificate and key in a single file (PKCS#8 format)
- `allow_invalid_certs`: Only enable in development environments to bypass certificate validation
For subgraphs using self-signed certificates, you'll need to set the root certificate. The identity file must contain both the client certificate and key in the same file. The client key can be in RSA, SEC1 Elliptic Curve, or PKCS#8 format.
When using a self-signed certificate for your subgraph server, ensure the hostname appears in the Subject Alternative Name (SAN) section of the certificate. This is important because the gateway's HTTP client uses rustls for TLS connections, which disregards the Common Name (CN) when SANs are missing.
For a practical example, see our [certificate generation script](https://github.com/grafbase/grafbase/tree/main/crates/integration-tests/data/mtls-subgraph/generate-certs.sh) used in integration tests.
---
# Gateway - Configuration - Telemetry
Configure telemetry settings to send traces, metrics, and logs to your preferred observability platform. The Grafbase Gateway automatically collects traces and metrics to the Grafbase dashboard when you run it with a valid Grafbase access token.
```toml
[telemetry]
service_name = "my-service"
```
- `service_name`: Set the service name to identify the Grafbase Gateway in the OpenTelemetry collector.
## Resource Attributes
Grafbase includes a standard set of resource attributes for every user. Define your own attributes to include them in all logs, traces, and metrics:
```toml
[telemetry.resource_attributes]
custom_key = "custom_value"
other_key = "other_value"
```
- `custom_key` and `other_key`: Define custom key-value pairs to include in all telemetry data.
## Global Exporters
To send traces to an OpenTelemetry endpoint, configure the OpenTelemetry exporter:
```toml
[telemetry.exporters.otlp]
enabled = true
endpoint = "http://localhost:1234"
protocol = "grpc"
timeout = "5s"
```
- `enabled`: Enables or disables the OpenTelemetry exporter. Default value is `false`.
- `endpoint`: Specifies the OpenTelemetry endpoint to send traces to.
- `protocol`: Specifies the protocol to use for the OpenTelemetry exporter. Either `http` or `grpc`. Default value is `grpc`.
- `timeout`: Specifies the timeout for the OpenTelemetry exporter. Default value is `60s`.
### Batch Exporter
Don't trigger a request for every span, trace, and metric event. Use batch processing to send requests at regular intervals. Configure the OpenTelemetry batch settings:
```toml
[telemetry.exporters.otlp.batch_export]
scheduled_delay = "5s"
max_queue_size = 2048
max_export_batch_size = 512
max_concurrent_exports = 1
```
- `scheduled_delay`: Specifies the delay, in seconds, between each batch export. Default value is `"5s"`.
- `max_queue_size`: Specifies the maximum number of items in the queue. Default value is `2048`.
- `max_export_batch_size`: Specifies the maximum number of items to export in a single batch. Default value is `512`.
- `max_concurrent_exports`: Specifies the maximum number of concurrent exports. Default value is `1`.
### gRPC Exporter
If using `grpc` as the `protocol`, the Gateway will use the following settings.
If you use TLS with a custom certificate for collectors, specify these TLS settings:
```toml
[telemetry.exporters.otlp.grpc.tls]
domain_name = "custom_name"
key = "/path/to/key.pem"
cert = "/path/to/cert.pem"
ca = "/path/to/ca.crt"
```
- `domain_name`: Identifies the domain name of the server's TLS certificate.
- `key`: Specifies the path to the secret key.
- `cert`: Specifies the path to the X509 certificate file in PEM format.
- `ca`: Specifies the path to the X509 CA certificate file in PEM format.
Define custom headers for gRPC collectors when needed:
```toml
[[telemetry.exporters.otlp.grpc.headers]]
authorization = "Bearer {{ env.GRPC_TOKEN }}"
[[telemetry.exporters.otlp.grpc.headers]]
custom = "static value"
```
### HTTP Exporter
If you set the `protocol` to `http`, the Gateway will use the following settings.
Define custom headers to send with every request:
```toml
[[telemetry.exporters.otlp.http.headers]]
authorization = "Bearer {{ env.GRPC_TOKEN }}"
[[telemetry.exporters.otlp.http.headers]]
custom = "static value"
```
The `http` exporter doesn't support TLS. Use the `grpc` exporter if you need TLS.
### Response Extension
The gateway returns the query plan and trace id in the GraphQL response extensions under `grafbase` for Pathfinder, our GraphQL query tool. The gateway enables this by default and returns it whenever it sees the `x-grafbase-telemetry` request header:
```toml
[telemetry.exporters.response_extension]
trace_id = true
query_plan = true
```
- `trace_id`: The response extension includes the current trace ID. Default value is `true`.
- `query_plan`: The response extension includes the query plan. Default value is `true`.
Define a special header to enable returning the response extension:
```toml
# Defines who can access the grafbase response extension.
[[telemetry.exporters.response_extension.access_control]]
rule = "header"
name = "x-grafbase-telemetry"
```
Deny access to everyone with:
```toml
[[telemetry.exporters.response_extension.access_control]]
rule = "deny"
```
You can require a specific value for the header. The Grafbase extension only accepts requests with the correct header value and rejects all others.
```toml
[[telemetry.exporters.response_extension.access_control]]
rule = "header"
name = "x-grafbase-telemetry"
value = "must-be-this-value"
```
Use environment variables to parameterize the configuration:
```toml
[[telemetry.exporters.response_extension.access_control]]
rule = "header"
name = "{{ env.HEADER_NAME }}"
value = "{{ env.SECRET }}"
```
## Log Exporter
The system logs are sent to the given global OpenTelemetry endpoint. If you want to send logs to a different endpoint, configure the OpenTelemetry logs exporter:
```toml
[telemetry.logs.exporters.otlp]
enabled = true
endpoint = "http://localhost:1235"
```
- `enabled`: Enables or disables the OpenTelemetry logs exporter. Default value is `true`.
- `endpoint`: Specifies the OpenTelemetry logs endpoint to send logs to.
Read more about OpenTelemetry options in the [global configuration section](#global-exporters).
## Traces
Change tracing settings in the gateway configuration:
```toml
[telemetry.tracing]
sampling = 1
parent_based_sampler = false
```
- `sampling`: The percentage of requests to trace as a floating point from 0 to 1. For high traffic, sampling every request can be expensive. Defaults to `0.15`.
- `parent_based_sampler`: Enables the [parent based sampler](https://opentelemetry.io/docs/specs/otel/trace/tracestate-probability-sampling/#parent-based-sampler) mechanism. When enabled, the gateway looks at the request headers to make trace sampling decisions. It falls back to its default sampling strategy when the request doesn't specify a sampling strategy. This option is disabled by default. Only enable it if you control all the clients, because malicious actors could create more load by manipulating sampling. Defaults to `false`.
### Collect Configuration
Configure limits for trace collection in this section.
```toml
[telemetry.tracing.collect]
max_events_per_span = 128
max_attributes_per_span = 128
max_links_per_span = 128
max_attributes_per_event = 128
max_attributes_per_link = 128
```
- `max_events_per_span`: Maximum number of events recorded per span. Defaults to `128`.
- `max_attributes_per_span`: Maximum number of attributes recorded per span. Defaults to `128`.
- `max_links_per_span`: Maximum number of links recorded per span. Defaults to `128`.
- `max_attributes_per_event`: Maximum number of attributes one event can have. Defaults to `128`.
- `max_attributes_per_link`: Maximum number of attributes one link can have. Defaults to `128`.
### Trace Exporter
Send traces to a custom endpoint independent of the global endpoint configuration:
```toml
[telemetry.tracing.exporters.otlp]
enabled = true
endpoint = "http://localhost:1235"
```
- `enabled`: Enables or disables the OpenTelemetry exporter. Default value is `true`.
- `endpoint`: Specifies the OpenTelemetry endpoint to send traces to.
Read more about OpenTelemetry options in the [global configuration section](#global-exporters).
### Propagation
Use `propagation` options to configure how tracing context (trace id, parent span id, and extra context) flows between incoming requests and subgraphs. The router has built-in support for multiple common standards. If you need support for additional formats, contact us.
You can use propagation to connect spans between the gateway and other services to get end-to-end visibility into request lifecycles for debugging and monitoring. The Grafbase dashboard doesn't handle trace propagation directly - to propagate traces, you must configure an additional OpenTelemetry endpoint in your gateway settings.
```toml
[telemetry.tracing.propagation]
trace_context = true
baggage = true
aws_xray = false
```
- `trace_context`: Enable [TraceContext](https://www.w3.org/TR/trace-context/) propagation through the `traceparent` header. This is the standard trace parent propagation mechanism in OpenTelemetry. Defaults to `false`.
- `baggage`: Enable [Baggage](https://opentelemetry.io/docs/concepts/signals/baggage/) context propagation through the `baggage` header. This is the standard context propagation mechanism in OpenTelemetry. Defaults to `false`.
- `aws_xray`: Enable [AWS X-Ray](https://docs.aws.amazon.com/xray/latest/devguide/xray-concepts.html#xray-concepts-tracingheader) propagation through the `x-amzn-trace-id` header. This is the builtin trace propagation mechanism in AWS X-Ray. Defaults to `false`.
## Metrics Exporter
Send metrics to a separate endpoint:
```toml
[telemetry.metrics.exporters.otlp]
enabled = true
endpoint = "http://localhost:1235"
```
- `enabled`: Enables or disables the OpenTelemetry metrics exporter. Default value is `true`.
- `endpoint`: Specifies the OpenTelemetry metrics endpoint to send metrics to.
Read more about OpenTelemetry options in the [global configuration section](#global-exporters).
---
# Gateway - Configuration - Transport Layer Security
You can configure the gateway to serve HTTPS traffic without a reverse proxy. When you don't define a `tls` section, the server uses plain HTTP mode.
```toml
[tls]
certificate = "/path/to/cert.pem"
key = "/path/to/key.pem"
```
- `certificate`: Specifies the path to your PEM format certificate file.
- `key`: Specifies the path to your PEM format private key file.
---
## Trusted Documents
```toml
[trusted_documents]
enabled = true
enforced = false
bypass_header_name = "my-header-name" # default null
bypass_header_value = "my-secret-is-{{ env.SECRET_HEADER_VALUE }}" # default null
document_id_unknown_log_level = "error" # default: info
document_id_and_query_mismatch_log_level = "off" # default: info
inline_document_unknown_log_level = "warn" # default: info
```
- `enabled`: Enables or disables handling of trusted documents. Regular queries are still accepted when this is `true`, but in addition, the gateway will accept queries with only a document id or the persisted query extension. Default value is `false`.
- `enforced`: When `true`, the gateway will enforce the usage of trusted documents, that is to say, GraphQL requests that contain a GraphQL document that isn't part of the trusted documents uploaded for the client will be rejected. Default value is `false`.
- `bypass_header_name` and `bypass_header_value`: If both values are not null, the router accepts arbitrary GraphQL documents whenever you pass the configured HTTP header. As seen in the example above, the value string can have interpolated environment variables, to avoid including secrets in your gateway configuration file.
- `document_id_unknown_log_level`: Log level of the log message emitted when a document id is present in the request, but the corresponding trusted document cannot be found. Default value is `info`.
- `document_id_and_query_mismatch_log_level`: Log level of the log message emitted when both a query document and a document id are sent, and the retrieved trusted document does not match the inline query document. Default value is `info`.
- `inline_document_unknown_log_level`: Log level of the log message emitted when an inline document (a string in the `"query"` key of a the request) is sent without document id, but no trusted document is found with the id matching the sha256 hash of the inline document. Default value is `info`.
Read more about [trusted documents](/docs/gateway/security/trusted-documents).
---
## Websocket subscriptions
Grafbase Gateway supports GraphQL subscriptions over websockets, in addition to SSE and multipart streams. The same protocol is used for communication between the client and the gateway, and between the gateway and the subgraph implementing the subscription: [graphql-transport-ws](https://github.com/graphql/graphql-over-http/blob/main/rfcs/GraphQLOverWebSocket.md). The protocol was developed and popularized by the [graphql-ws](https://github.com/enisdenjo/graphql-ws/blob/master/PROTOCOL.md) library. It is being standardized as part of the GraphQL over HTTP specification, and in our experience, it is by far the most common.
If you need the gateway to support other websocket protocols, please [let us know](/contact)!
The gateway exposes websocket subscriptions on the `/ws` endpoint, with the `ws://` or `wss://` scheme. The gateway will automatically upgrade the connection to a websocket connection if the client sends a `Connection: Upgrade` header. Please note that the the `Sec-WebSocket-Protocol` is required (and its value must currently be `graphql-transport-ws`), or the gateway will reject the request with a 400 Bad Request status code.
## Configuration
```toml
[websockets]
forward_connection_init_payload = false
```
- `forward_connection_init_payload`: When set to `true`, the gateway will forward the [ConnectionInit payload](https://github.com/graphql/graphql-over-http/blob/main/rfcs/GraphQLOverWebSocket.md#connectioninit) to the subgraph. This is useful when the subgraph requires additional information from the client, for example access tokens, during the connection initialization phase. The default value is `true`.
---
# Gateway - Errors
Our implementation follows the [GraphQL-over-HTTP](https://github.com/graphql/graphql-over-http/blob/main/spec/GraphQLOverHTTP.md) specification, which defines three main request scenarios:
- The server might deny requests due to missing authentication, rate limits, invalid JSON, or similar issues. In these cases, it returns an appropriate `4xx` or `5xx` status code.
- For a well-formed GraphQL-over-http request, your `Accept` header determines:
- For `application/json`, the server returns a `200` status code.
- For `application/graphql-response+json`:
- When errors occur without any `data`, the server returns the appropriate `4xx` or `5xx` status code.
- When the server generates at least a partial response, it returns a `200` status code.
## Status Codes
When you send a request with the `Accept` header value `application/graphql-response+json`, you receive the following status codes when the server denies your request:
- `400`: Invalid format in GraphQL-over-http request (for example: invalid JSON)
- `401`: Request needs authentication
- `406`: Request has missing or unsupported `Accept` header
- `429`: Request exceeded rate limit
- `500`: Server encountered an internal error
## Error Codes
All GraphQL errors include an error `code` in `extensions`. Each code corresponds to a HTTP status code. For request errors (where `data` is not present), these codes specify the response when the client sends `Accept: application/graphql-response+json`. When multiple errors occur, the server prioritizes client error `4xx` over server error `5xx`.
### Status Code: 400
- `BAD_REQUEST`: Server detected a client error and refused to process the request.
- `TRUSTED_DOCUMENT_ERROR`: System can't load or find the trusted document.
- `PERSISTED_QUERY_ERROR`: Automatic persisted query fails.
- `PERSISTED_QUERY_NOT_FOUND`: System requires an automatic persisted query that doesn't exist.
- `OPERATION_PARSING_ERROR`: Operation parsing fails.
- `OPERATION_VALIDATION_ERROR`: Operation validation fails.
- `OPERATION_PLANNING_ERROR`: Operation planning fails.
### Status Code: 401
- `UNAUTHENTICATED`: User is not authenticated.
### Status Code: 403
- `UNAUTHORIZED`: User is not authorized.
### Status Code: 429
- `RATE_LIMITED`: Request was rate limited.
### Status Code: 500
- `INTERNAL_SERVER_ERROR`: Internal server error.
- `HOOK_ERROR`: Hook failed or returned an error.
### Status Code: 502
- `SUBGRAPH_ERROR`: GraphQL error coming from the subgraph.
- `SUBGRAPH_INVALID_RESPONSE_ERROR`: Subgraph returned an invalid response.
- `SUBGRAPH_REQUEST_ERROR`: Request to the subgraph failed.
### Status Code: 504
- `GATEWAY_TIMEOUT`: Request execeed the global timeout.
---
# Gateway - Telemetry - Tracing Spans and Attributes
The Grafbase Gateway sends spans in certain points in the request execution. These spans are used to measure the time taken by the Gateway to execute a request and to provide insights into the request execution.
The following default attributes apply to all spans:
- `busy_ns`: Time the span remained active in nanoseconds.
- `code.filepath`: Code file path.
- `code.lineno`: Line number in the code where this span originated.
- `code.namespace`: Module name.
- `idle_ns`: Time the span remained idle in nanoseconds.
- `thread.id`: Runtime thread ID.
- `thread.name`: Runtime thread name.
## HTTP Request
**Span name**: ` `.
The root span monitors the complete request lifecycle. Additional spans descend from this root span.
**Attributes**:
- `grafbase.kind`: The span kind, which is always `http-request` for the root span.
- `graphql.operations.name`: The name or names of the executed operation(s).
- `graphql.operations.type`: The type or types of the executed operation(s).
- `graphql.response.errors.count`: The number of errors in the response.
- `graphql.response.errors.count_by_code.codes`: Distinct error codes in the response.
- `graphql.response.errors.count_by_code.counts`: The number of errors for each distinct error code.
- `http.request.body.size`: The size of the request body.
- `http.request.header.x-forwarded-for`: The client IP address.
- `http.request.header.x-grafbase-client-name`: The name of the client.
- `http.request.header.x-grafbase-client-version`: The version of the client.
- `http.request.method`: The HTTP method.
- `http.response.body.size`: The size of the response body.
- `server.address`: The server address.
- `url.path`: The URL path.
- `user_agent.original`: The user agent.
## Hook: on-gateway-request
**Span name**: `hook: on-gateway-request`.
You'll only see this span if you define the `on-gateway-request` hook.
The span has two child spans:
- `get instance from the pool`: Taking the instance from a pool.
- `call instance`: Execution of the actual instance code.
## Authenticate
**Span name**: `authenticate`.
You'll only see this span if you enable authentication.
## Global Rate Limit
**Span name**: `rate limit`.
You'll only see this span if you enable global rate limiting with Redis storage.
## Operation Execution
**Span name**: ``.
Operation execution spans are created for each operation in the request.
**Attributes**;
- `grafbase.kind`: The span kind, which is always `graphql-operation` for operation execution spans.
- `grafbase.operation.computed_name`: The name of the operation. For named operations, this shows the operation name. For unnamed operations, this shows a name derived from the query.
- `graphql.operation.document`: The normalized query that hides all possible data.
- `graphql.operation.type`: The type of the operation: `query`, `mutation` or `subscription`.
- `graphql.response_data.is_present`: Whether the response data is present.
- `graphql.response.errors.count_by_code`: Distinct error codes in the response with their counts.
## Operation Preparation
**Span name**: `prepare operation`.
This span plans the operation execution and operates as a child of the operation execution span.
## Subgraph Execution
**Span name**: ``.
The gateway creates subgraph execution spans for each subgraph in the request. These spans become children of the operation execution span.
**Attributes**:
- `subgraph.name`: The name of the subgraph.
- `grafbase.kind`: The span kind, which is always `subgraph-graphql-request` for subgraph execution spans.
- `graphql.operation.document`: The subgraph receives this query. The system replaces all data with variables to prevent exposure of sensitive data.
- `graphql.operation.type`: The type of the operation: `query`, `mutation` or `subscription`.
- `graphql.response_data.is_present`: Whether the response data is present.
## Hook: on-subgraph-request
**Span name**: `hook: on-subgraph-request`.
This span appears when you define the `on-subgraph-request` hook and operates as a child of the subgraph execution span.
The span has two child spans:
- `get instance from the pool`: Taking the instance from a pool.
- `call instance`: Execution of the actual instance code.
## Subgraph Rate Limit
**Span name**: `rate limit`.
This span appears when you enable rate limiting to the subgraph with Redis storage.
**Attributes**:
- `subgraph.name`: The name of the subgraph.
## HTTP Request
**Span name**: `POST `.
This span tracks HTTP requests to the subgraph. When you enable retries and requests fail, the gateway creates multiple spans. All spans act as children of the subgraph execution span.
**Attributes**:
- `http.request.method`: The HTTP method.
- `http.response.status_code`: The HTTP status code.
- `server.address`: The server address.
- `server.port`: The server port.
## Hook: on-subgraph-response
**Span name**: `hook: on-subgraph-response`.
The gateway creates this span when you define the `on-subgraph-response` hook. This span acts as a child of the subgraph execution span.
The span has two child spans:
- `get instance from the pool`: Taking the instance from a pool.
- `call instance`: Execution of the actual instance code.
## Hook: on-operation-response
**Span name**: `hook: on-operation-response`.
The gateway creates this span when you define the `on-subgraph-response` hook. This span acts as a child of the operation execution span.
The span has two child spans:
- `get instance from the pool`: Taking the instance from a pool.
- `call instance`: Execution of the actual instance code.
## Hook: on-http-response
**Span name**: `hook: on-http-response`.
The gateway creates this span when you define the `on-http-response` hook. This span acts as a child of the root span.
The span has two child spans:
- `get instance from the pool`: Taking the instance from a pool.
- `call instance`: Execution of the actual instance code.
---
# Gateway - Telemetry - Metrics and Attributes
The Grafbase Gateway delivers metrics for requests and operations to an OpenTelemetry endpoint. Metrics include counters, histograms, and gauges at various points in the system.
The exponential histograms include a `Count` field, which doubles any histogram as a counter metric. If you can't find a specific counter, check if any of the histograms can serve that purpose.
## HTTP Request Duration
**Metric Name:** `http.server.request.duration`
This exponential histogram measures the time in milliseconds for each HTTP request and helps you track the final response time for those requests. It includes the following attributes:
- `http.response.status_code`: The HTTP status code.
- `http.request.method`: The HTTP request method.
- `http.route`: The request path.
- `network.protocol.version`: The HTTP version of the request.
- `server.address`: The server's listen address.
- `server.port`: The server's listen port.
- `url.scheme`: Either `http` or `https`, depending on whether TLS is enabled in the gateway.
- `http.headers.x-grafbase-client-name`: The name of the client that triggered this request, if available.
- `http.headers.x-grafbase-client-version`: The version of the client that triggered this request, if available.
- `graphql.response.status`: Indicates whether the underlying GraphQL operation succeeded, if available.
## Connected Clients
**Metric Name:** `http.server.connected.clients`
This up/down counter tracks currently connected clients, incrementing on an incoming request and decrementing upon any response.
## Request Body Sizes
**Metric Name:** `http.server.request.body.size`
This exponential histogram measures request body sizes.
## Response Body Sizes
**Metric Name:** `http.server.response.body.size`
This exponential histogram measures response body sizes.
## GraphQL Operation Duration
**Metric Name:** `graphql.operation.duration`
This exponential histogram measures the time in milliseconds for every valid operation in the GraphQL engine. The metric includes the following attributes:
- `graphql.document`: The normalized query of this operation, stripped of all variables. This value cannot contain any private data.
- `graphql.operation.type`: The type of the operation (either `query`, `mutation`, or `subscription`).
- `graphql.operation.name`: The name of the operation, if provided.
- `graphql.response.status`: Indicates if the response succeeded.
- `http.headers.x-grafbase-client-name`: The name of the client that triggered this request, if available.
- `http.headers.x-grafbase-client-version`: The version of the client that triggered this request, if available.
## GraphQL Operation Errors
**Metric Name:** `graphql.operation.errors`
This counter tracks distinct GraphQL errors per request. The metric contains the following attributes:
- `graphql.response.error.code`: The error code returned to the user.
- `graphql.operation.name`: The name of the operation, if present.
- `http.headers.x-grafbase-client-name`: The name of the client, if present.
- `http.headers.x-grafbase-client-version`: The version of the client, if present.
## Request Batch Sizes
**Metric Name:** `graphql.operation.batch.size`
This exponential histogram measures the number of batched requests sent to the engine. It counts the total number of batched requests while measuring the number of requests in the batch.
## Subgraph Request Duration
**Metric Name:** `graphql.subgraph.request.duration`
This exponential histogram measures the time in milliseconds for every subgraph request. It helps track execution time and includes the following attributes:
- `graphql.subgraph.name`: The requested subgraph's name.
- `graphql.subgraph.response.status`: Indicates if the response succeeded.
- `http.response.status_code`: The HTTP status code.
## Subgraph Retries
**Metric Name:** `graphql.subgraph.request.retries`
This counter tracks retried subgraph requests. To enable this counter, you must [enable retries](/docs/gateway/configuration). The counter increments when a subgraph request fails and the engine retries it. The metric includes the following attributes:
- `graphql.subgraph.name`: The requested subgraph's name.
- `graphql.subgraph.aborted`: Indicates if the retries stopped and if the request became an error.
## Subgraph Request Sizes
**Metric Name:** `graphql.subgraph.request.body.size`
This exponential histogram measures subgraph request body sizes in bytes. The metric includes the following attribute:
- `graphql.subgraph.name`: The requested subgraph's name.
## Subgraph Response Sizes
**Metric Name:** `graphql.subgraph.response.body.size`
This exponential histogram measures successful subgraph response body sizes in bytes. The metric includes the following attribute:
- `graphql.subgraph.name`: The requested subgraph's name.
## Subgraph In-Flight Requests
**Metric Name:** `graphql.subgraph.request.inflight`
This up/down counter tracks in-flight subgraph requests. It increments when requesting a subgraph and decrements upon any response. The metric includes the following attribute:
- `graphql.subgraph.name`: The requested subgraph's name.
## Subgraph Cache Hits
**Metric Name:** `graphql.subgraph.request.cache.hit`
This counter tracks hits of subgraph entity caches. Enable this counter by [activating entity caching](/docs/gateway/performance/entity-caching). The metric includes the following attribute:
- `graphql.subgraph.name`: The requested subgraph's name.
## Subgraph Cache Misses
**Metric Name:** `graphql.subgraph.request.cache.miss`
This counter tracks misses of subgraph entity caches. Enable this counter by [activating entity caching](/docs/gateway/performance/entity-caching). The metric includes the following attribute:
- `graphql.subgraph.name`: The requested subgraph's name.
## Operation Cache Hits
**Metric Name:** `graphql.operation.cache.hit`
This counter tracks hits for operation plan caches.
## Operation Cache Misses
**Metric Name:** `graphql.operation.cache.miss`
This counter tracks misses for operation plan caches.
## Operation Preparation Duration
**Metric Name:** `graphql.operation.prepare.duration`
This exponential histogram measures the time in milliseconds taken to prepare an operation. This includes:
- Fetching a trusted document, if enabled and available.
- Fetching a query plan from the in-memory cache.
- If the plan is not cached, parsing the query into an AST and then determining the plan.
The metric includes the following attributes:
- `graphql.operation.name`: The name of the operation, if present.
- `graphql.document`: The normalized operation if parsing succeeds.
- `graphql.operation.success`: Indicates if the preparation finished successfully.
## Hook Duration
**Metric Name:** `grafbase.hook.duration`
This exponential histogram measures the time in milliseconds taken to execute a [hook](/guides/implementing-gateway-hooks). The metric includes the following attributes:
- `grafbase.name.hook`: The name of the hook function.
- `grafbase.hook.status`: Indicates if the hook call succeeded (`SUCCESS`), or if it failed due to errors from Grafbase code (`HOST_ERROR`), or from user code (`GUEST_ERROR`).
## Hook Pool Busy Instances
**Metric Name:** `grafbase.hook.pool.instances.busy`
This counter counts the number of active instances in the hook instance pool. Each instance processes one request at a time, which is why the gateway utilizes a pool to handle multiple requests concurrently.
## Hook Pool Instances Size
**Metric Name:** `grafbase.hook.pool.instances.size`
This counter tracks the total number of instances in the hook instance pool. [Configure the maximum pool size in the gateway configuration](/docs/gateway/configuration/hooks). The gateway adjusts the pool size automatically based on the current load.
## Pending Access Logs
**Metric Name:** `grafbase.gateway.access_log.pending`
This counter measures the amount of access log events not yet written to the access log file. [Read more](/guides/implementing-gateway-hooks#access-logs-with-response-hooks) on access logs.
## Rate-Limit Duration
**Metric Name:** `grafbase.gateway.rate_limit.duration`
This exponential histogram measures the time in milliseconds taken to query the current request rate from Redis. This metric requires enabling the [Redis-based rate-limiting](/docs/gateway/security/rate-limiting#using-redis-for-rate-limiting).
## Graph Delivery Network Fetch Duration
**Metric Name:** `gdn.request.duration`
This exponential histogram measures the time in milliseconds to fetch a graph from the Graph Delivery Network. This metric only activates in [hybrid mode](/docs/self-hosted-gateway#hybrid-operation). The metric includes the following attributes:
- `server.address`: The Graph Delivery Network endpoint URL.
- `gdn.response.kind`: The response status kind, either `new`, `unchanged`, `http_error`, or `gdn_error`.
- `http.response.status_code`: The status code of the request.
---
# Platform - API
The [Grafbase Dashboard](/dashboard) is powered by the Grafbase API. This same API is available for users to manage their account and projects programmatically.
Everything you have access to do inside the Grafbase Dashboard can be done using the Grafbase API.
**This API is always changing and may introduce breaking changes at any point.**
## Endpoint
You make GraphQL requests to: `https://api.grafbase.com/graphql`
## Auth
You will need a valid [Access Token](/docs/gateway/security/access-tokens) that you will need to pass as an `Authorization` header.
The header should the Bearer authentication format:
`Authorization: Bearer TOKEN`
## Schema
The Grafbase API endpoint has introspection enabled so you can use any GraphQL Playground (Postman, Insomnia, GraphiQL) to view the schema documentation.
---
# Platform - Schema Checks
The Schema Registry runs a suite of checks on a schema.
You can check a subgraph schema before publishing to a federated graph.
Run Schema Checks with the `grafbase check` command. Read more in the [reference documentation](/docs/cli/commands/check).
A successful check returns a successful exit code (0).
Check errors return a non-zero exit code and print the errors, making the command suitable for scripts and CI pipelines.
## Workflow
When you run `grafbase check`, the Schema Registry:
1. Gathers all subgraph schemas for the branch
2. Validates each schema as a valid GraphQL schema
3. Composes all subgraph schemas together with the new version of the checked subgraph
The Schema Check fails if errors occur in steps 2 or 3.
## Operation Checks
APIs evolve. Most changes add functionality: new mutations, fields on types, or input objects for filtering collections. You can make these changes safely without breaking API consumers.
Other changes break clients using queries written for previous API versions. Common examples include removing fields or adding required field arguments. These changes disrupt service because GraphQL servers reject invalid queries that don't match the current schema.
Operation Checks help prevent breaking changes to your GraphQL schema. They provide rules that surface breaking changes as errors when you run `grafbase check`.
Breaking changes must meet two criteria:
- The change breaks existing functionality. See [list of breaking changes](#list-of-breaking-changes).
- Clients actively use the changed or removed schema parts.
Without the second criterion, Operation Checks would prevent schema iteration even for unused parts. Operation checks analyze request data to focus on actual API usage rather than theoretical breaking changes.
### Configuration
Configure Operation Checks in the dashboard as an opt-in feature.
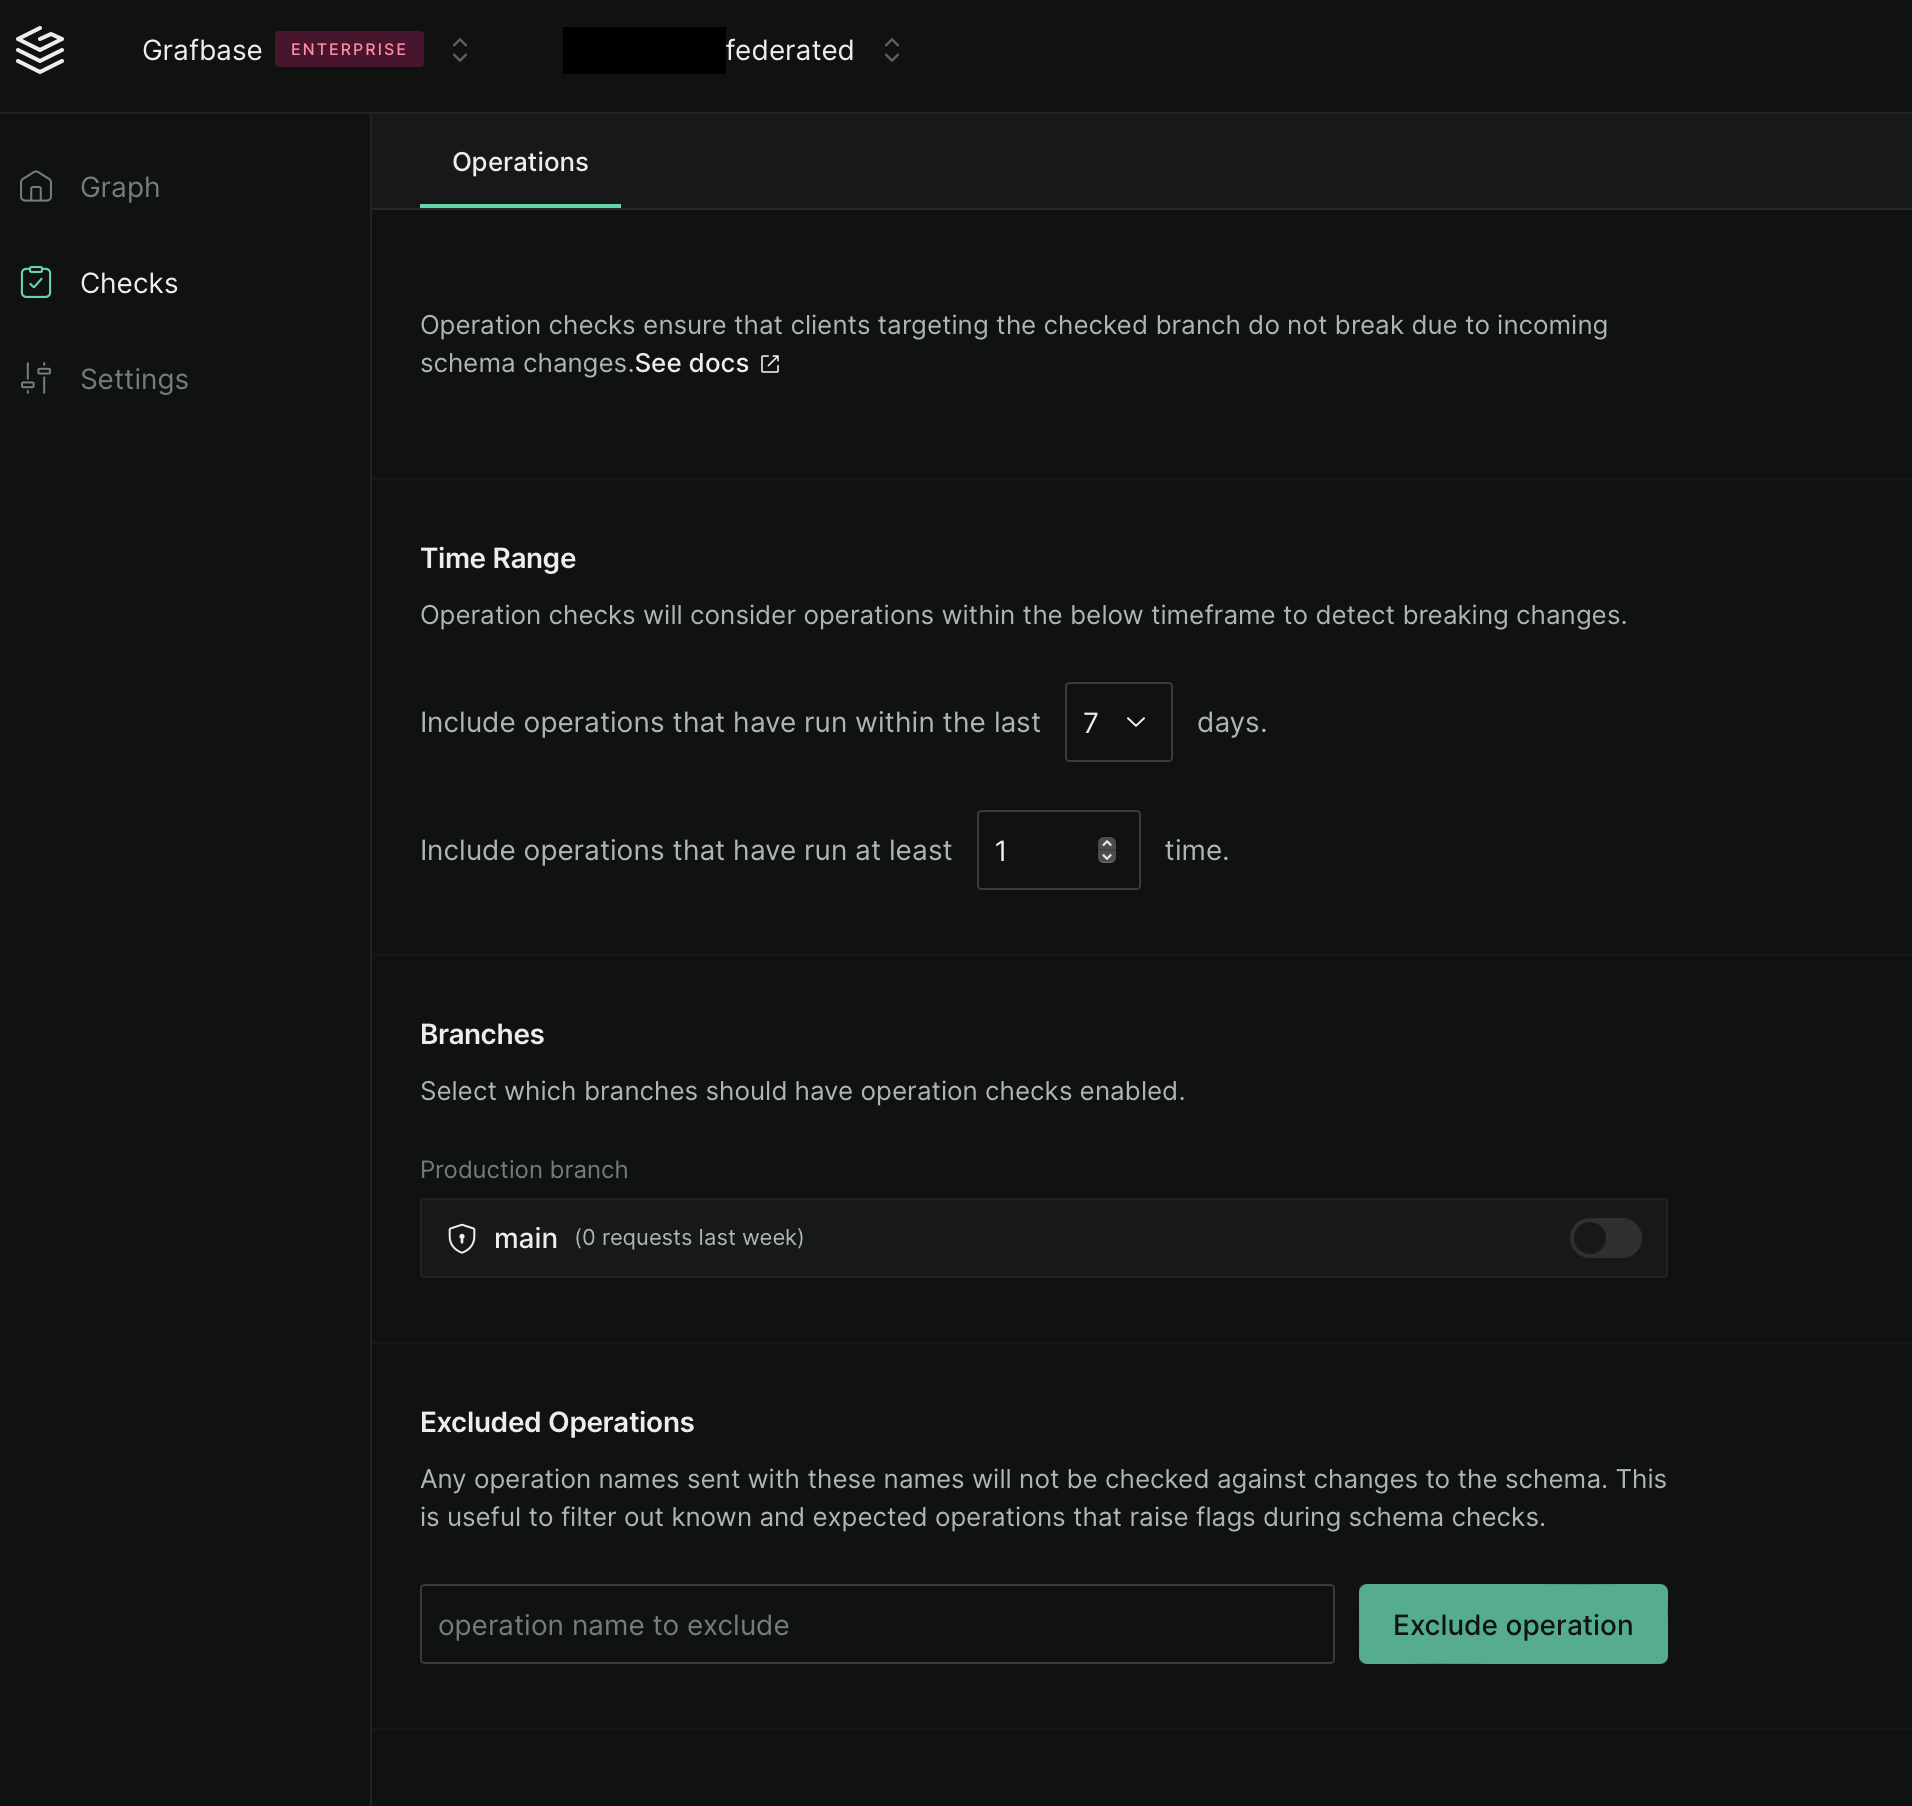
Enable checks for your entire graph or specific branches. Select query thresholds and timeframes for schema usage analysis.
Exclude operations by name. For example, this GraphQL document names the operation "JapaneseProducts":
```graphql
query JapaneseProducts {
products(filter: { madeIn: "JP" }) {
id
name
}
}
```
Exclude specific clients by identifying them through the `x-grafbase-client-name` header. Include this header in any GraphQL client.
### Running Operation Checks
The `grafbase check` command runs Operation Checks with other schema checks. Errors indicate breaking changes that would occur when deploying the new schema. The system analyzes real client usage data from the target branch.
### List of breaking changes
This list shows potentially breaking changes:
- Removal of a root query, mutation or subscription type.
- Removal of an object, interface or input object field.
- Removal of a field argument.
- Removal of an interface from `implements`.
- Removal of a member type in a union.
- Removal of a value of an enum.
- Addition of a nonnullable argument on a field.
- Addition of a nonnullable field on an input object.
- Change of a field's type.
- Either change of the _inner_ type: `String` becoming `Int` for example,
- or a change of wrapping types making the field nullable: `String!` to `String` or `[String!]` to `[String]` for example. The client would not expect null here.
- Change of a field argument's type.
- Either change of the _inner_ type: `String` becoming `Int` for example,
- or a change of wrapping types making the argument nonnullable: `String` to `String!` or `[String]` to `[String!]` for example. The client could be passing null.
- Removal of a field argument's default, if the argument is required.
We check actual usage before returning Operation Check errors. For example, the removal of a field will only be breaking if a field has actually been used by clients in the configured time window.
## Lint Checks
Lint checks analyze your schema to find potential issues like mistakes, oversights or disallowed behaviors that don't cause hard compilation errors.
### Lint Rules
- Naming conventions
- Types: `PascalCase`
- Forbidden prefixes: `"Type"`
- Forbidden suffixes: `"Type"`
- Fields: `camelCase`
- Input values: `camelCase`
- Arguments: `camelCase`
- Directives: `camelCase`
- Enums: `PascalCase`
- Forbidden prefixes: `"Enum"`
- Forbidden suffixes: `"Enum"`
- Unions
- Forbidden prefixes: `"Union"`
- Forbidden suffixes: `"Union"`
- Enum values: `SCREAMING_SNAKE_CASE`
- Interfaces
- Forbidden prefixes: `"Interface"`
- Forbidden suffixes: `"Interface"`
- Query fields
- Forbidden prefixes: `["query", "get", "list"]`
- Forbidden suffixes: `"Query"`
- Mutation fields
- Forbidden prefixes: `["mutation", "put", "post", "patch"]`
- Forbidden suffixes: `"Mutation"`
- Subscription fields
- Forbidden prefixes: `"subscription"`
- Forbidden suffixes: `"Subscription"`
- Usage of the `@deprecated` directive requires specifying the `reason` argument
### Where Lints Run
- The CLI runs lint checks through `grafbase check` or in the dashboard after passing validation and composition checks
- Run lint checks locally on SDL schemas with the `grafbase lint` command
## Proposal Checks
Proposal checks enforce that all changes in the checked schema — compared to the currently published schema — are part of an approved [schema proposal](/docs/platform/schema-proposals). The changes must not exactly match a given proposal, they only have to be part of any approved proposal. That means a given check or publish can implement in parts on in entirety one or more proposals. The check is based on semantic diffs between the checked schema and the relevant approved proposals.
Proposal checks are opt-in. You can enable them in the dashboard's Graph settings page.
### Example
```bash
$ grafbase check --schema products.graphql --name products grafbase/fed-demo@main
Grafbase CLI 0.82.3
⏳ Checking...
Errors were found in your schema check:
Proposal checks
❌ [Error] No approved schema proposal contains the field `name` in the new object type `Seller`
```
## Custom Checks
Custom checks extend Grafbase's built-in schema validation capabilities with your own business logic and validation rules. They run alongside standard schema checks and can enforce organization-specific standards, domain-specific rules, or integrate with other systems to validate your GraphQL schemas.
The errors and warnings from custom checks are part of the schema check results, just like the results of built-in schema checks.
### Example use cases for Custom Checks
- Enforcing naming conventions beyond built-in lint rules
- Validating domain-specific constraints (e.g., certain fields must always appear together)
- Ensuring compliance with your organization's API design guidelines
- Integrating with other systems to validate business logic
- Preventing anti-patterns specific to your implementation
### Implementation approach
Custom checks are implemented as webhooks that receive information about the subgraph schema being checked. You can build these webhooks using any language or framework and host them on your own infrastructure or serverless platforms.
To add a custom check, you must provide a webhook that will receive an event every time schema checks are run, and return an OK response with a potentially empty list of errors and warnings. These webhooks can be synchronous or asynchronnous.
### Synchronous Custom Checks
Synchronous custom checks respond immediately with validation results. These are ideal for quick validations that don't require extensive processing.
The webhook will receive an event with following JSON body shape:
```typescript
type SyncWebhookEvent = {
graph_id: string
branch_id: string
git: {
commit_url: string | null
commit_message: string | null
commit_sha: string | null
branch_name: string | null
author: string | null
}
subgraph: {
name: string
schema: string // full GraphQL schema being checked
}
}
```
The webhook must return a JSON response with a 200 HTTP status code and a body following this schema:
```typescript
type SyncWebhookResponse = {
diagnostics: Diagnostic[]
}
type Diagnostic = {
message: string
severity: "ERROR" | "WARNING"
}
```
If the webhook fails to respond in less than 12 seconds, or it responds with a
non-200 exit code, the custom check will be considered failing.
An empty `diagnostics` array corresponds to a successful check.
The errors and warnings will be part of the the check's results. Any failure to return a response with a 200 status and a valid body will also be an error in the check results, making the check fail.
#### Example sync custom check webhook implementation
```typescript
const express = require('express');
const { parse, visit } = require('graphql');
const app = express();
app.use(express.json());
app.post('/custom-check', (req, res) => {
const { subgraph } = req.body;
const diagnostics = [];
try {
const parsedSchema = parse(subgraph.schema);
const inputTypes = new Set();
const mutationFields = [];
// Collect all input types
visit(parsedSchema, {
InputObjectTypeDefinition(node) {
inputTypes.add(node.name.value);
}
});
// Check mutation fields
visit(parsedSchema, {
ObjectTypeDefinition(node) {
if (node.name.value === 'Mutation') {
node.fields.forEach(field => {
mutationFields.push(field.name.value);
// Check if there's a corresponding input type
const expectedInputName = `${field.name.value}Input`;
if (!inputTypes.has(expectedInputName)) {
diagnostics.push({
message: `Mutation "${field.name.value}" should have a corresponding input type "${expectedInputName}"`,
severity: "WARNING"
});
}
});
}
}
});
res.json({ diagnostics });
} catch (error) {
res.status(500).json({
diagnostics: [{
message: `Failed to analyze schema: ${error.message}`,
severity: "ERROR"
}]
});
}
});
app.listen(3000, () => console.log('Custom check webhook running on port 3000'));
```
### Asynchronous Custom Checks
Asynchronous custom checks are designed for more complex validations that may take longer to process or require integration with other systems.
> **Coming soon:** Asynchronous custom checks are currently in development. If you have specific use cases that would benefit from async custom checks, please contact us to become a design partner and help shape this feature.
### Configuring custom checks
Once you have implemented and exposed the webhook, you can enter its url in the Settings tab of your graph in the Grafbase dashboard:
After implementing your webhook:
1. Navigate to the Settings tab of your graph in the Grafbase dashboard
2. Find the "Custom Checks" section
3. Enter your webhook URL
4. Add any headers that your webhook expects
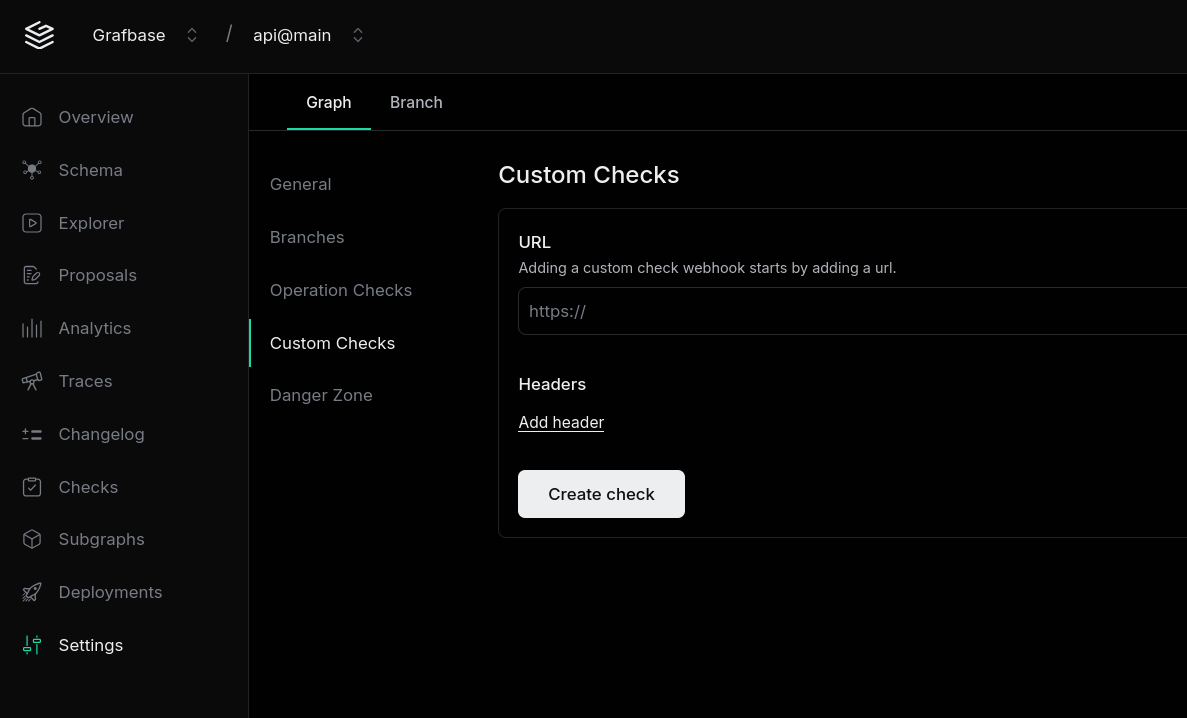
## Dashboard
View past schema checks in the `Checks` tab of the Grafbase dashboard.
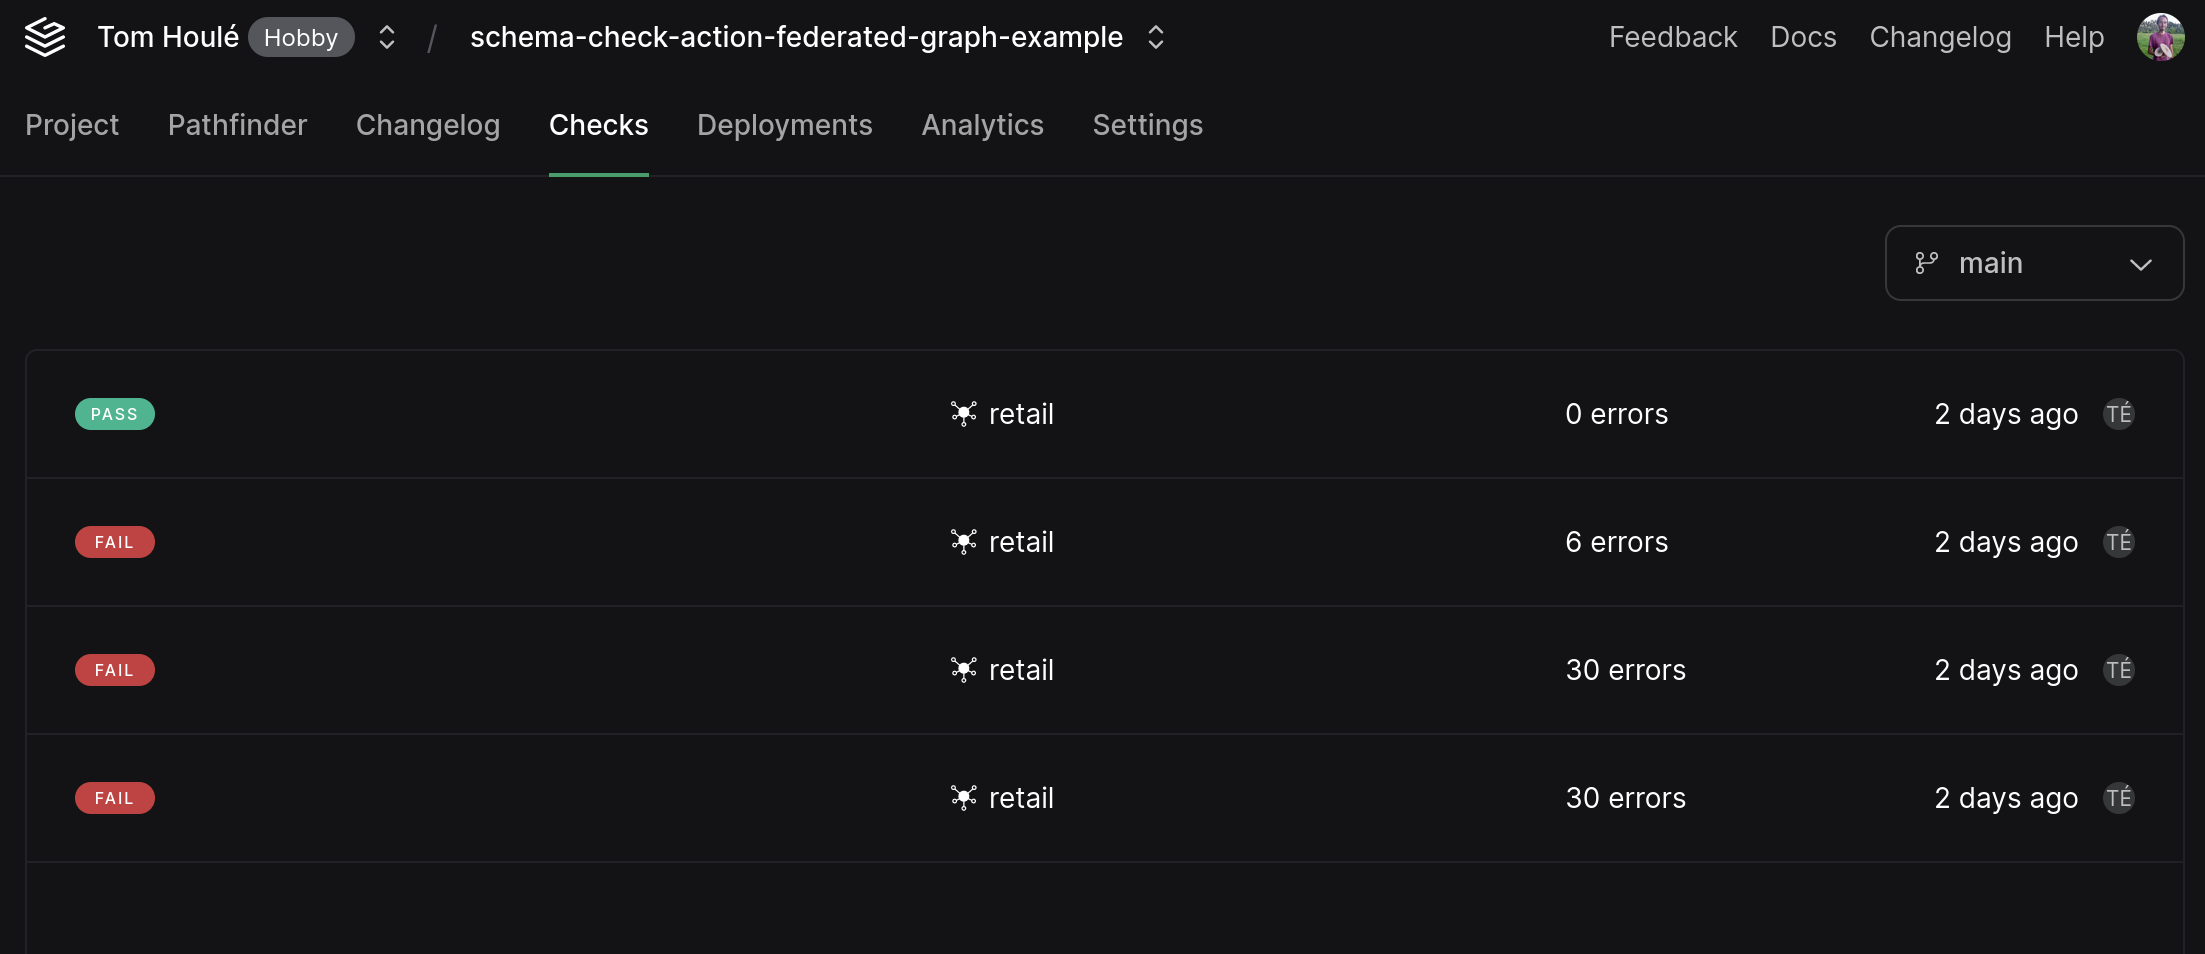
## Using `grafbase check` in CI
_If you use GitHub Actions for CI, there is a pre-packaged and documented [grafbase-schema-check action](https://github.com/marketplace/actions/grafbase-schema-check-action) that uses the same approach as the description below._.
Use the command in scripts by providing the same arguments as interactive use.
Authentication differs from interactive use. Instead of the `grafbase login` flow, provide a Grafbase access token. Generate tokens in the dashboard:
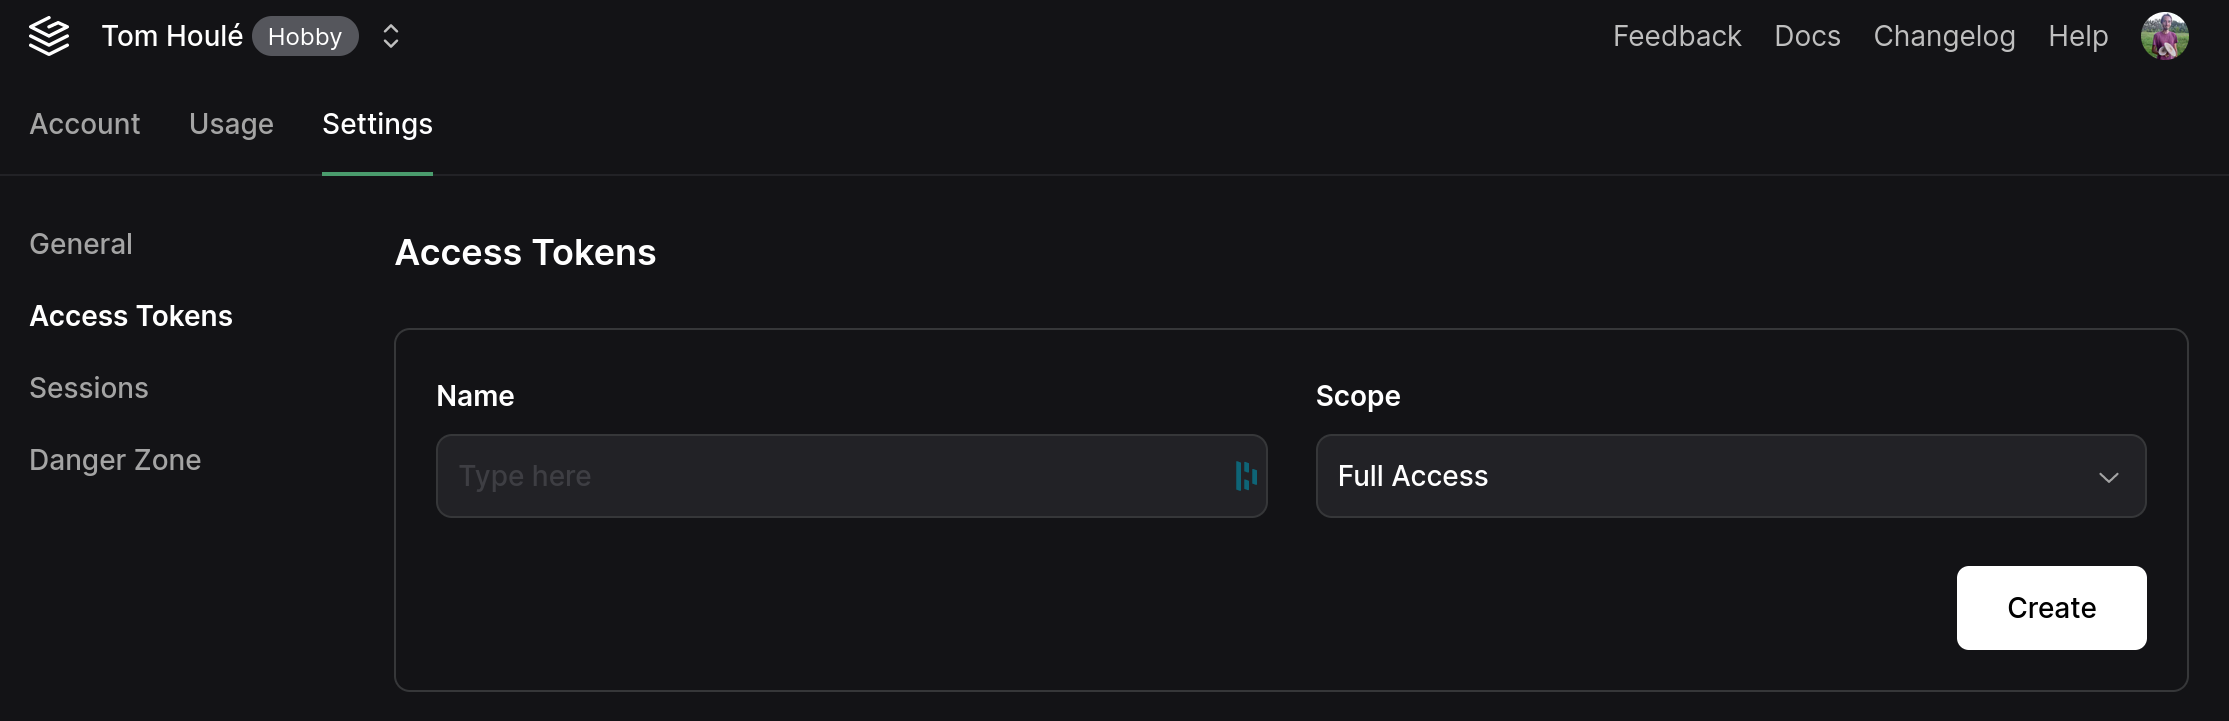
The `grafbase introspect --dev` command generates GraphQL schema files for the `--schema` argument of `grafbase check`. See examples in the [GitHub workflow](https://github.com/tomhoule/grafbase-schema-check-action-single-graph-example/blob/main/.github/workflows/check.yml) of the [example repository](https://github.com/tomhoule/grafbase-schema-check-action-single-graph-example/tree/main). A [federated graph example](https://github.com/tomhoule/grafbase-schema-check-action-federated-graph-example) is also available.
---
# Platform - Schema Proposals
Schema changes are high stakes, they may expose the wrong data, or expose it in confusing or inefficient ways to the client. They may not be consistent with the rest of the API schema, they may be missing important directives. Schema Proposals are a workflow to design, discuss, review and approve changes to subgraph schemas before they can be published. They are a design and governance tool.
Users and teams interact with proposals from three different angles:
- As author, you create and edit proposals, submit them for review, and iterate on them.
- As reviewer, you are notified of new proposals, you can comment on them, request changes, approve or reject them.
- As subgraph implementer, you can publish new subgraph versions containing changes from approved proposals.
Proposals are typically authored by the teams that own the subgraphs (in which case the author and subgraph implementer would be the same), other teams, product designers, or client teams who need changes to the GraphQL schema. Reviewers are typically subgraph owners, team leads, or members of teams managing cross-cutting concerns like authorization or API conventions.
## Walkthrough
The following steps follow a typical schema proposal along its lifecycle. Each step is prefixed with the personas who would be involved in that step.
1. **(Author)** Create a new Schema Proposal in the Proposals tab.
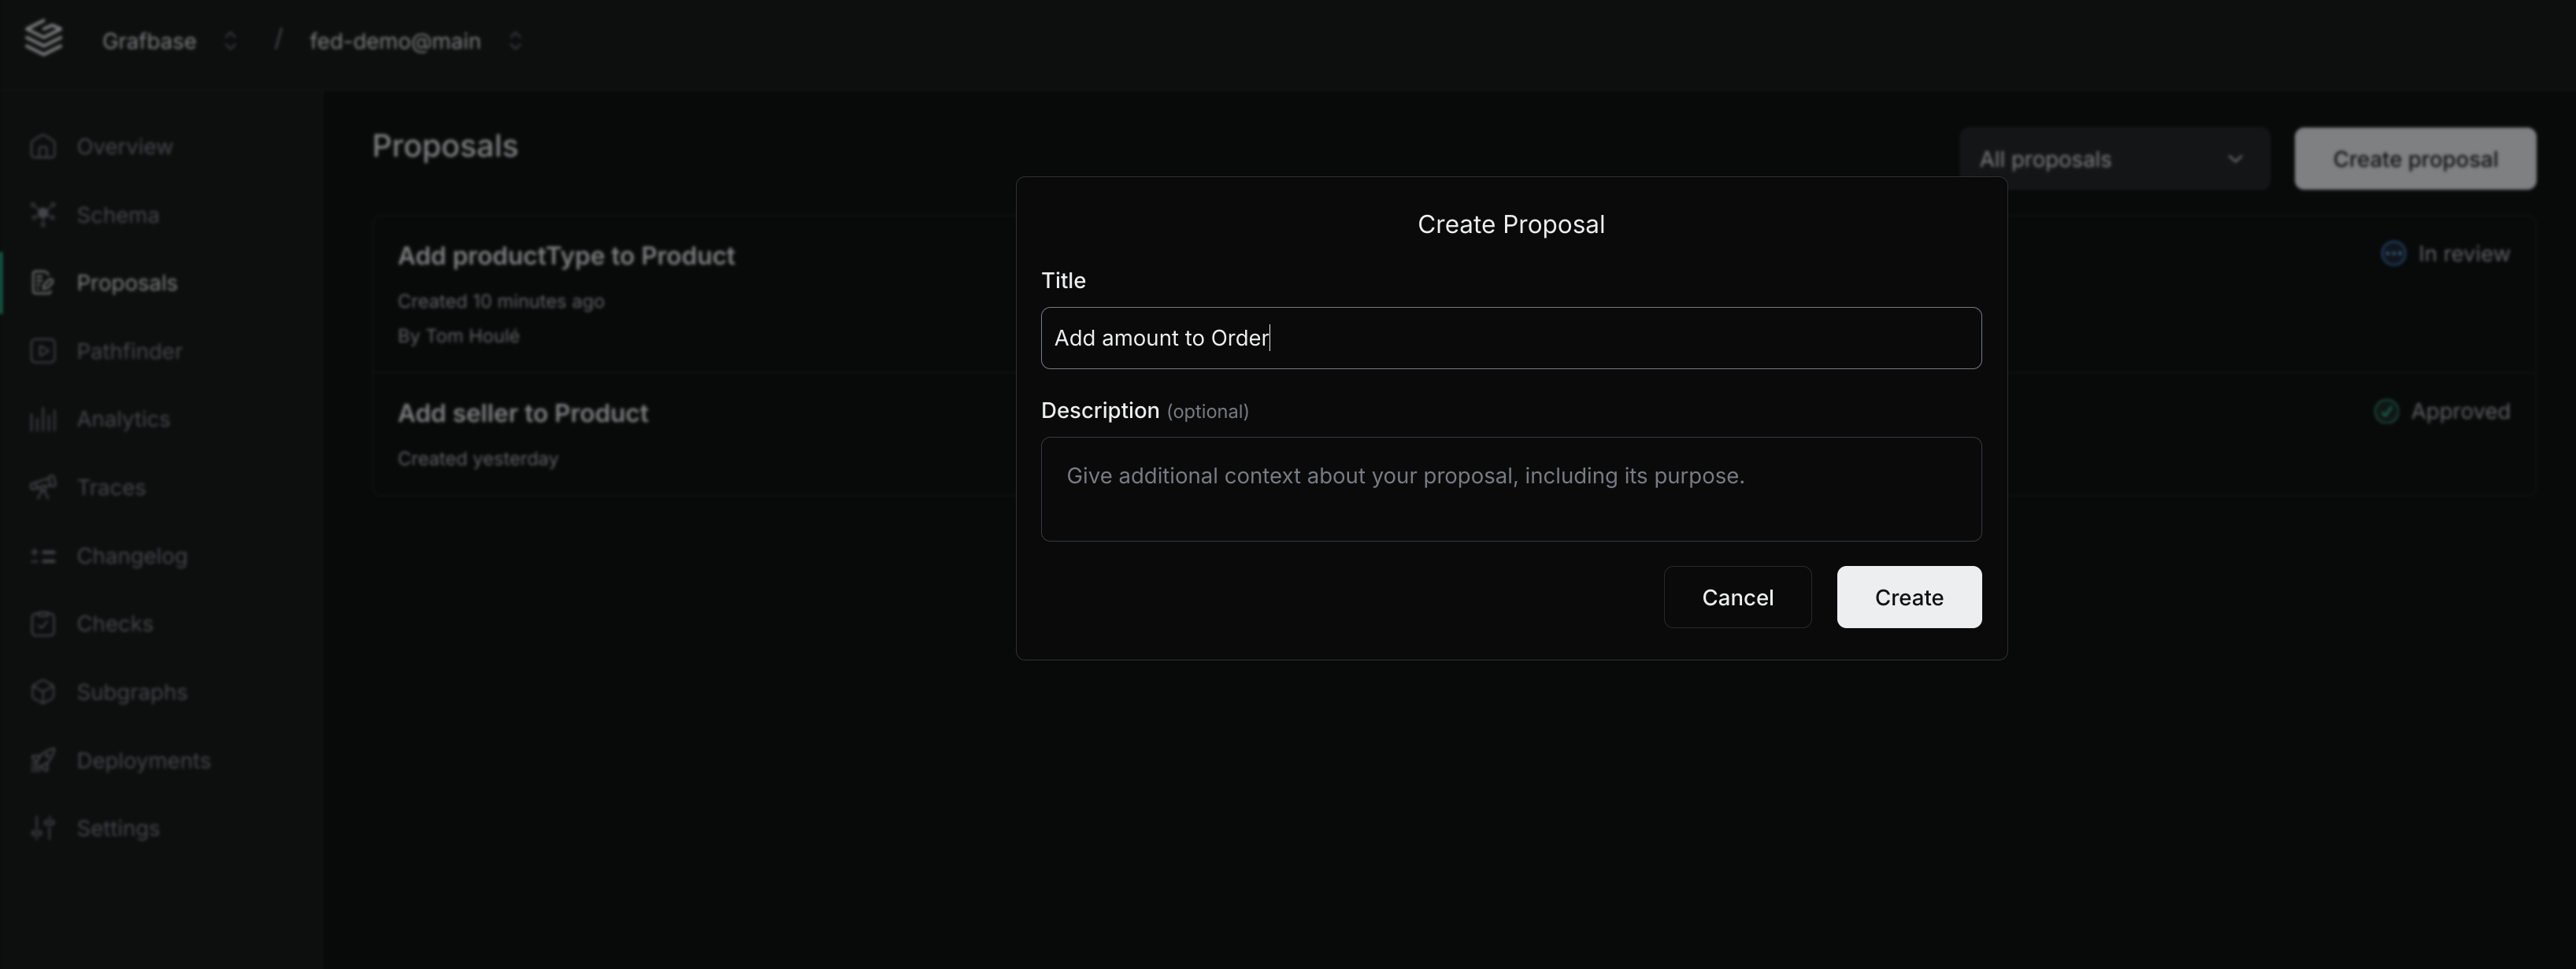
2. **(Author)** The proposal is created. It is in draft mode, nobody has been notified yet at this point.
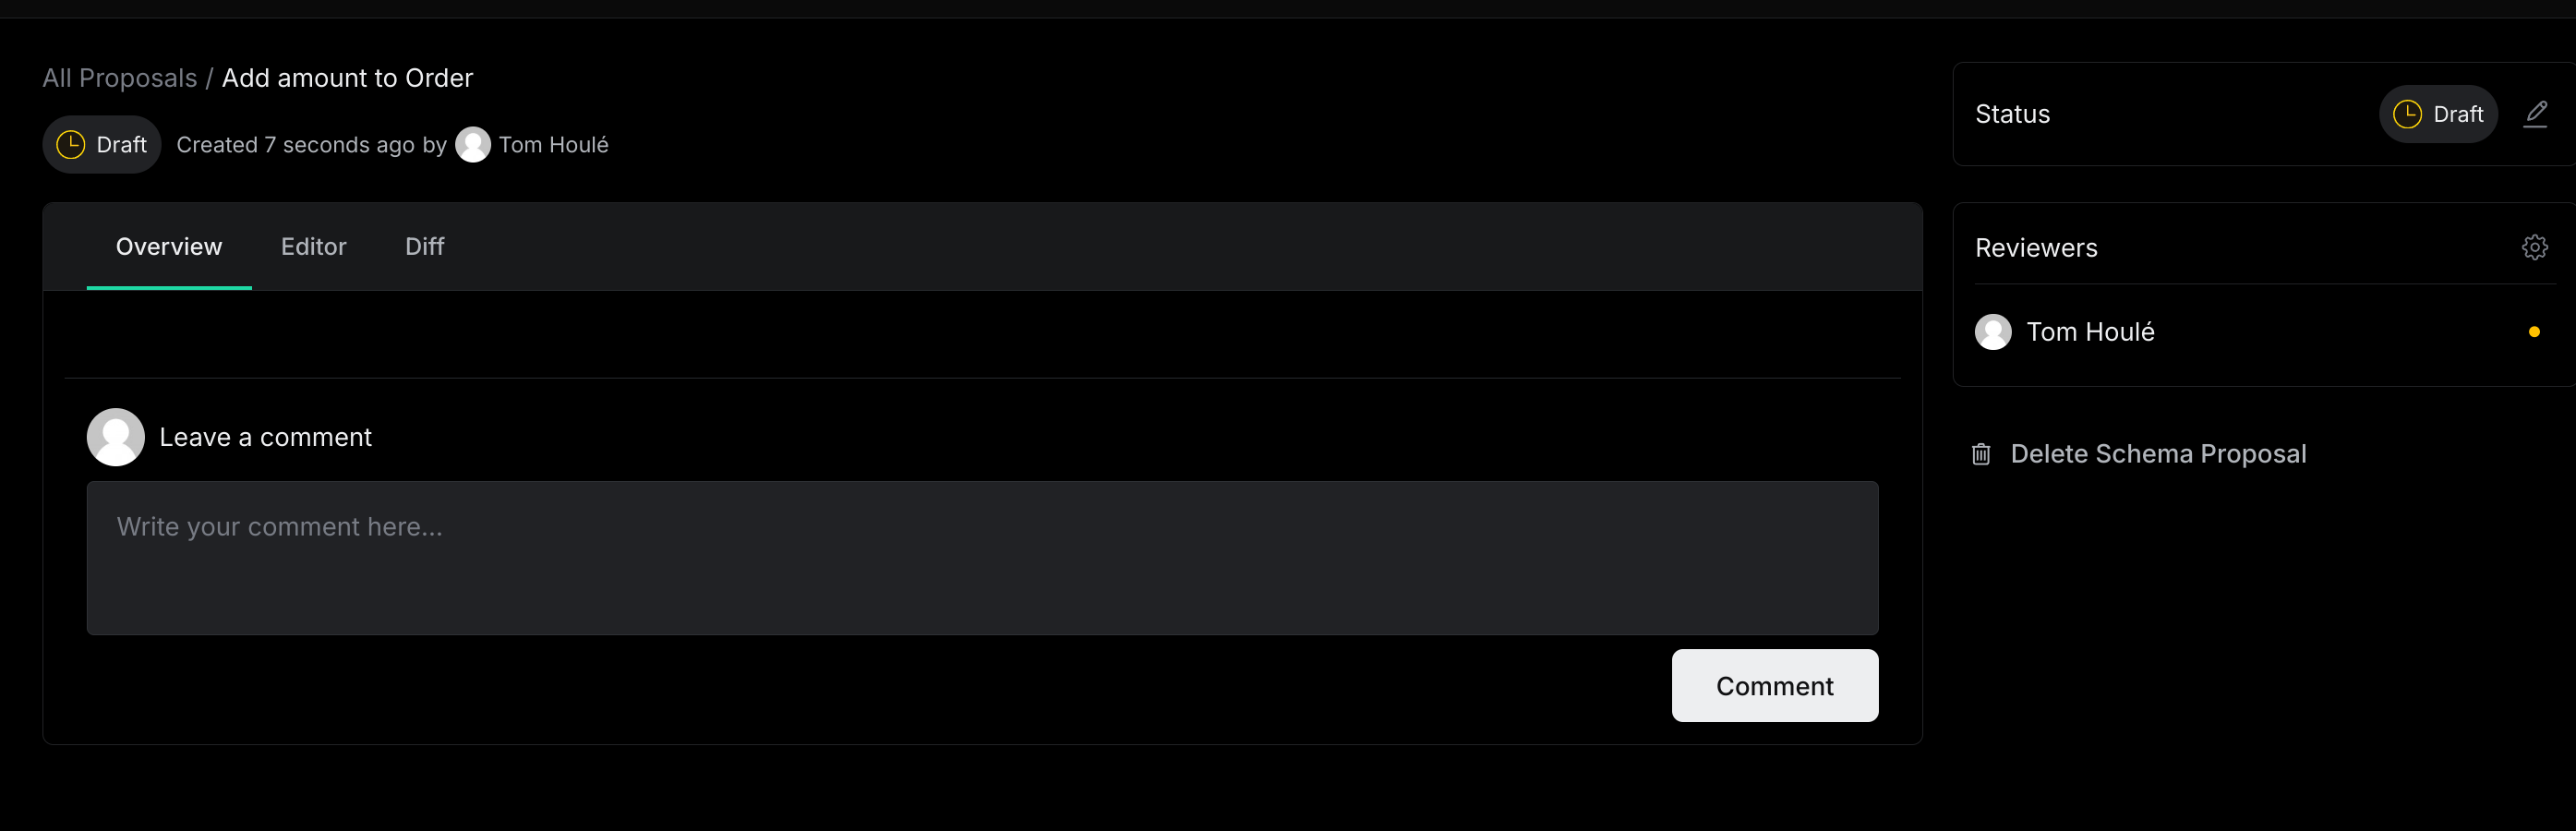
3. **(Author)** Edit, create, delete subgraph schemas. Save the changes.
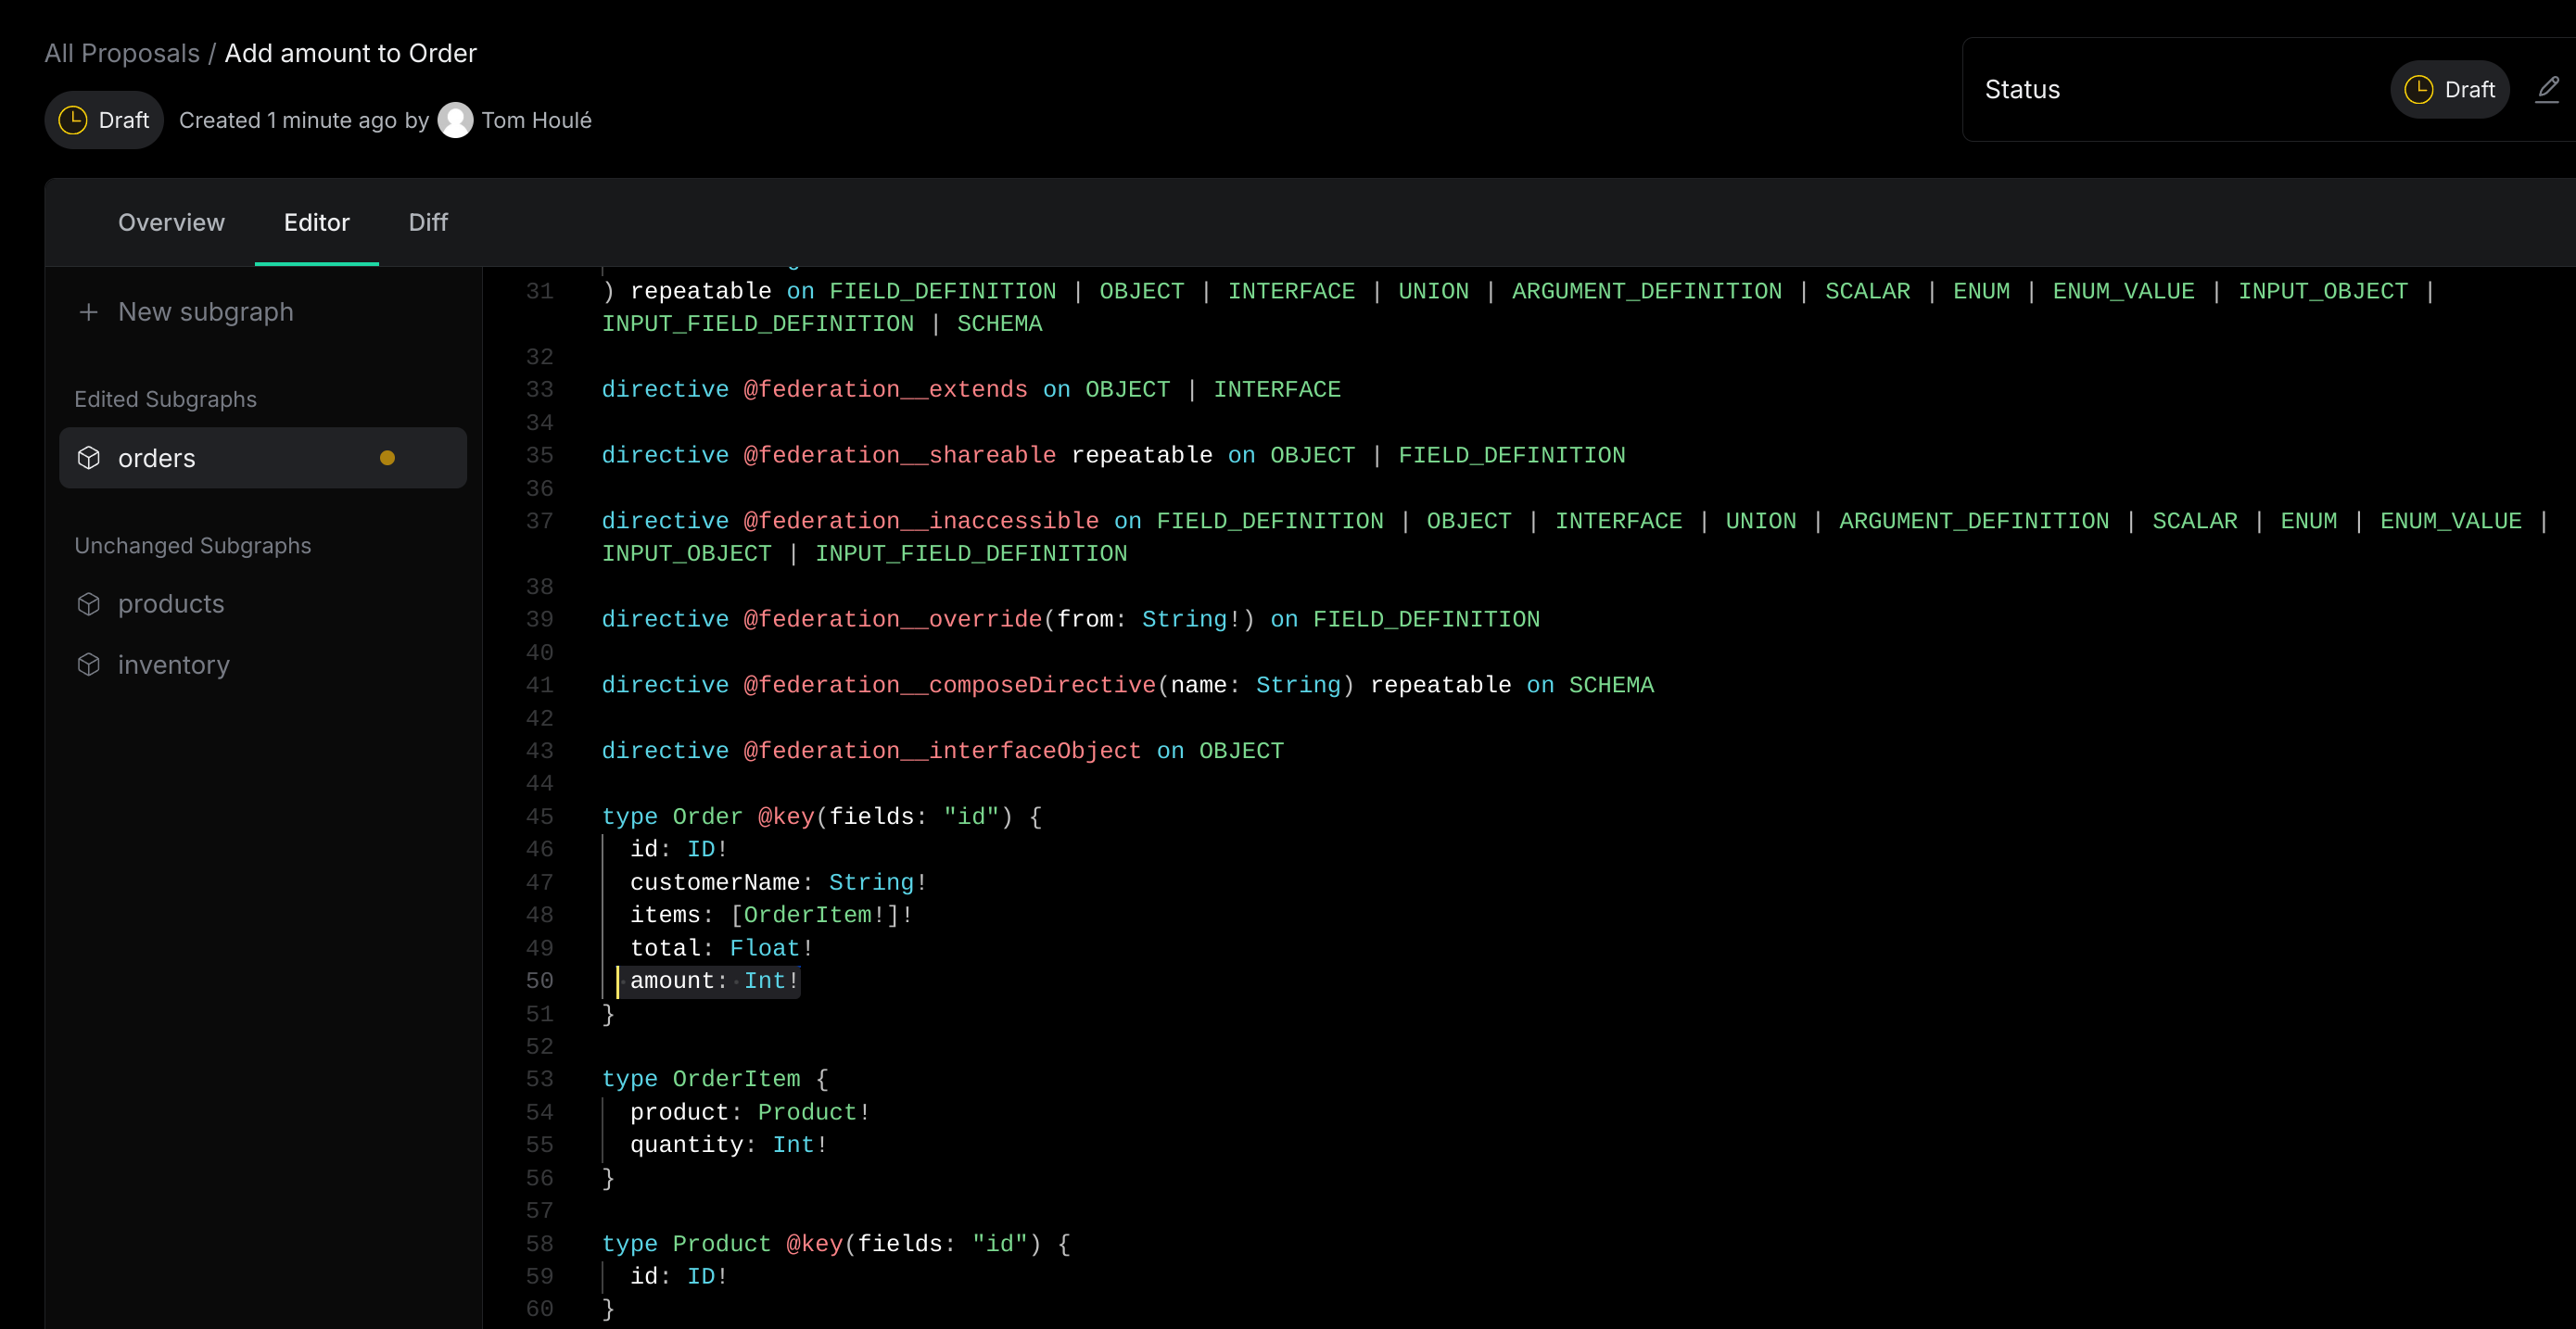
4. **(Author)** Submit the proposal for review.
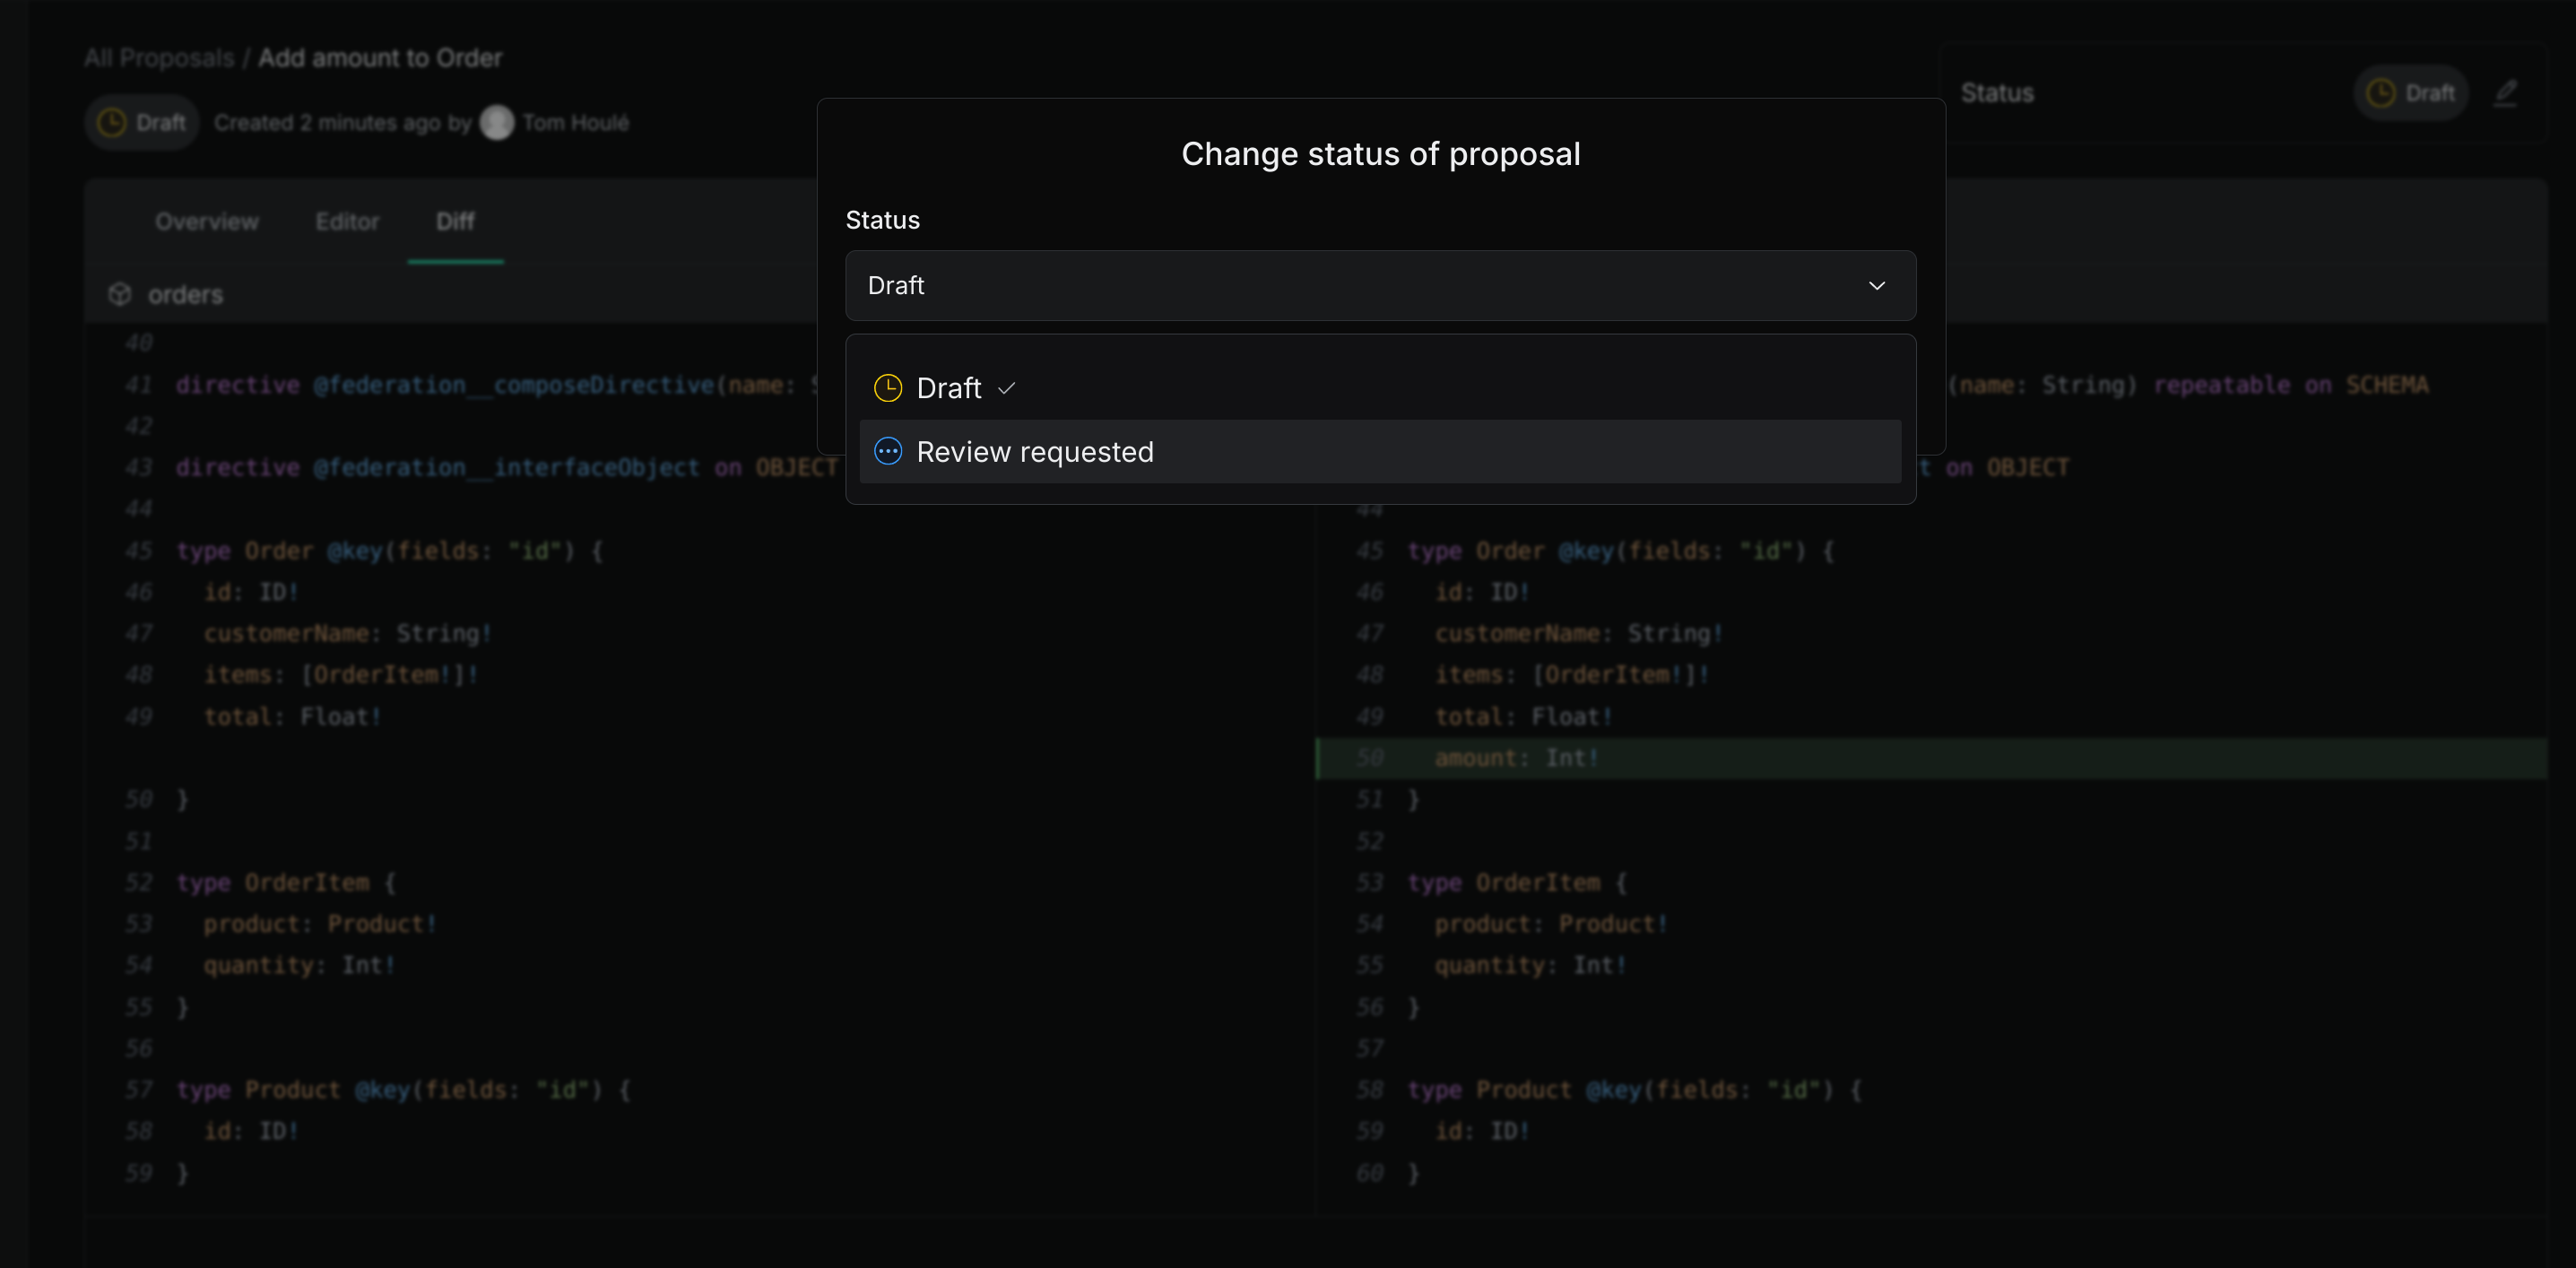
5. **(Reviewers)** The reviewers are notified. They can comment on the proposal, request changes, approve or reject it.
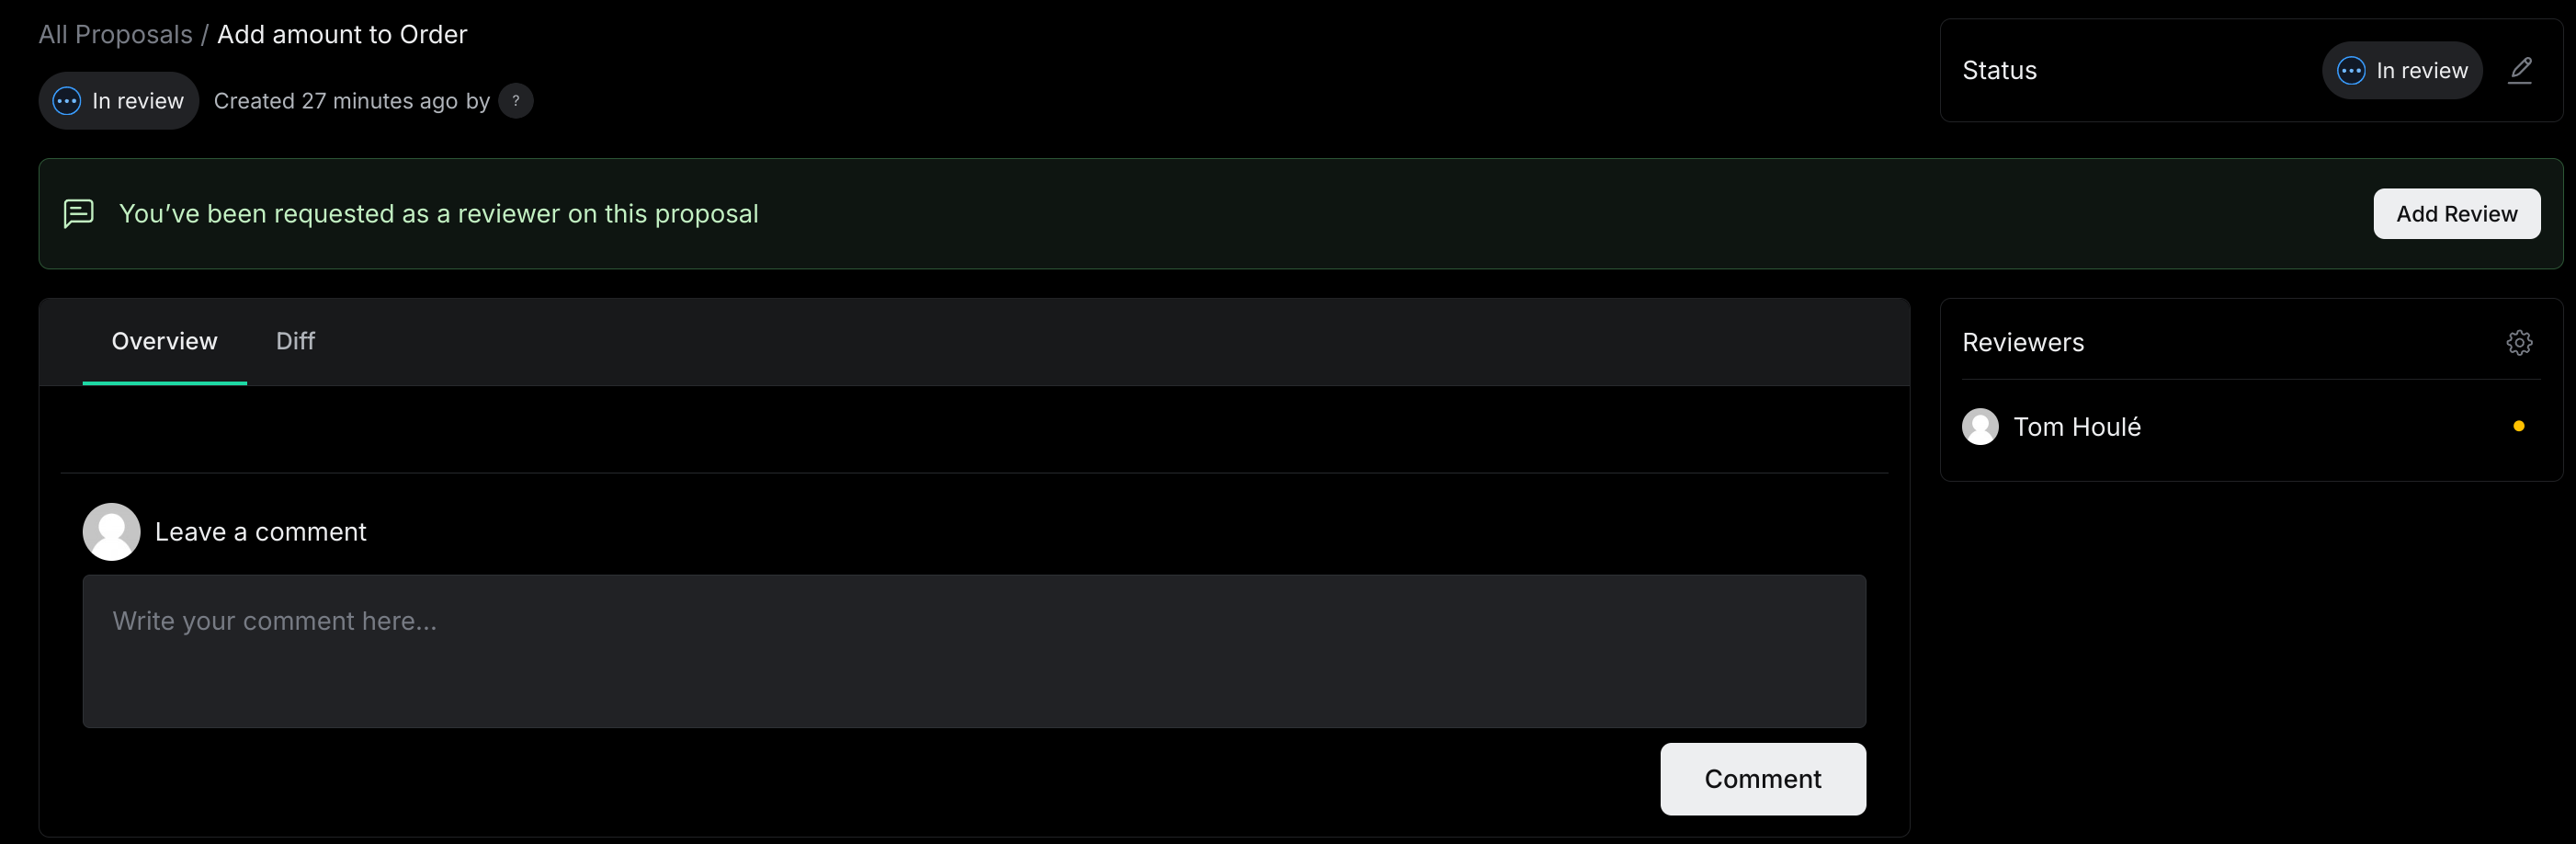
6. **(Author and reviewers)** The proposal is iterated on.
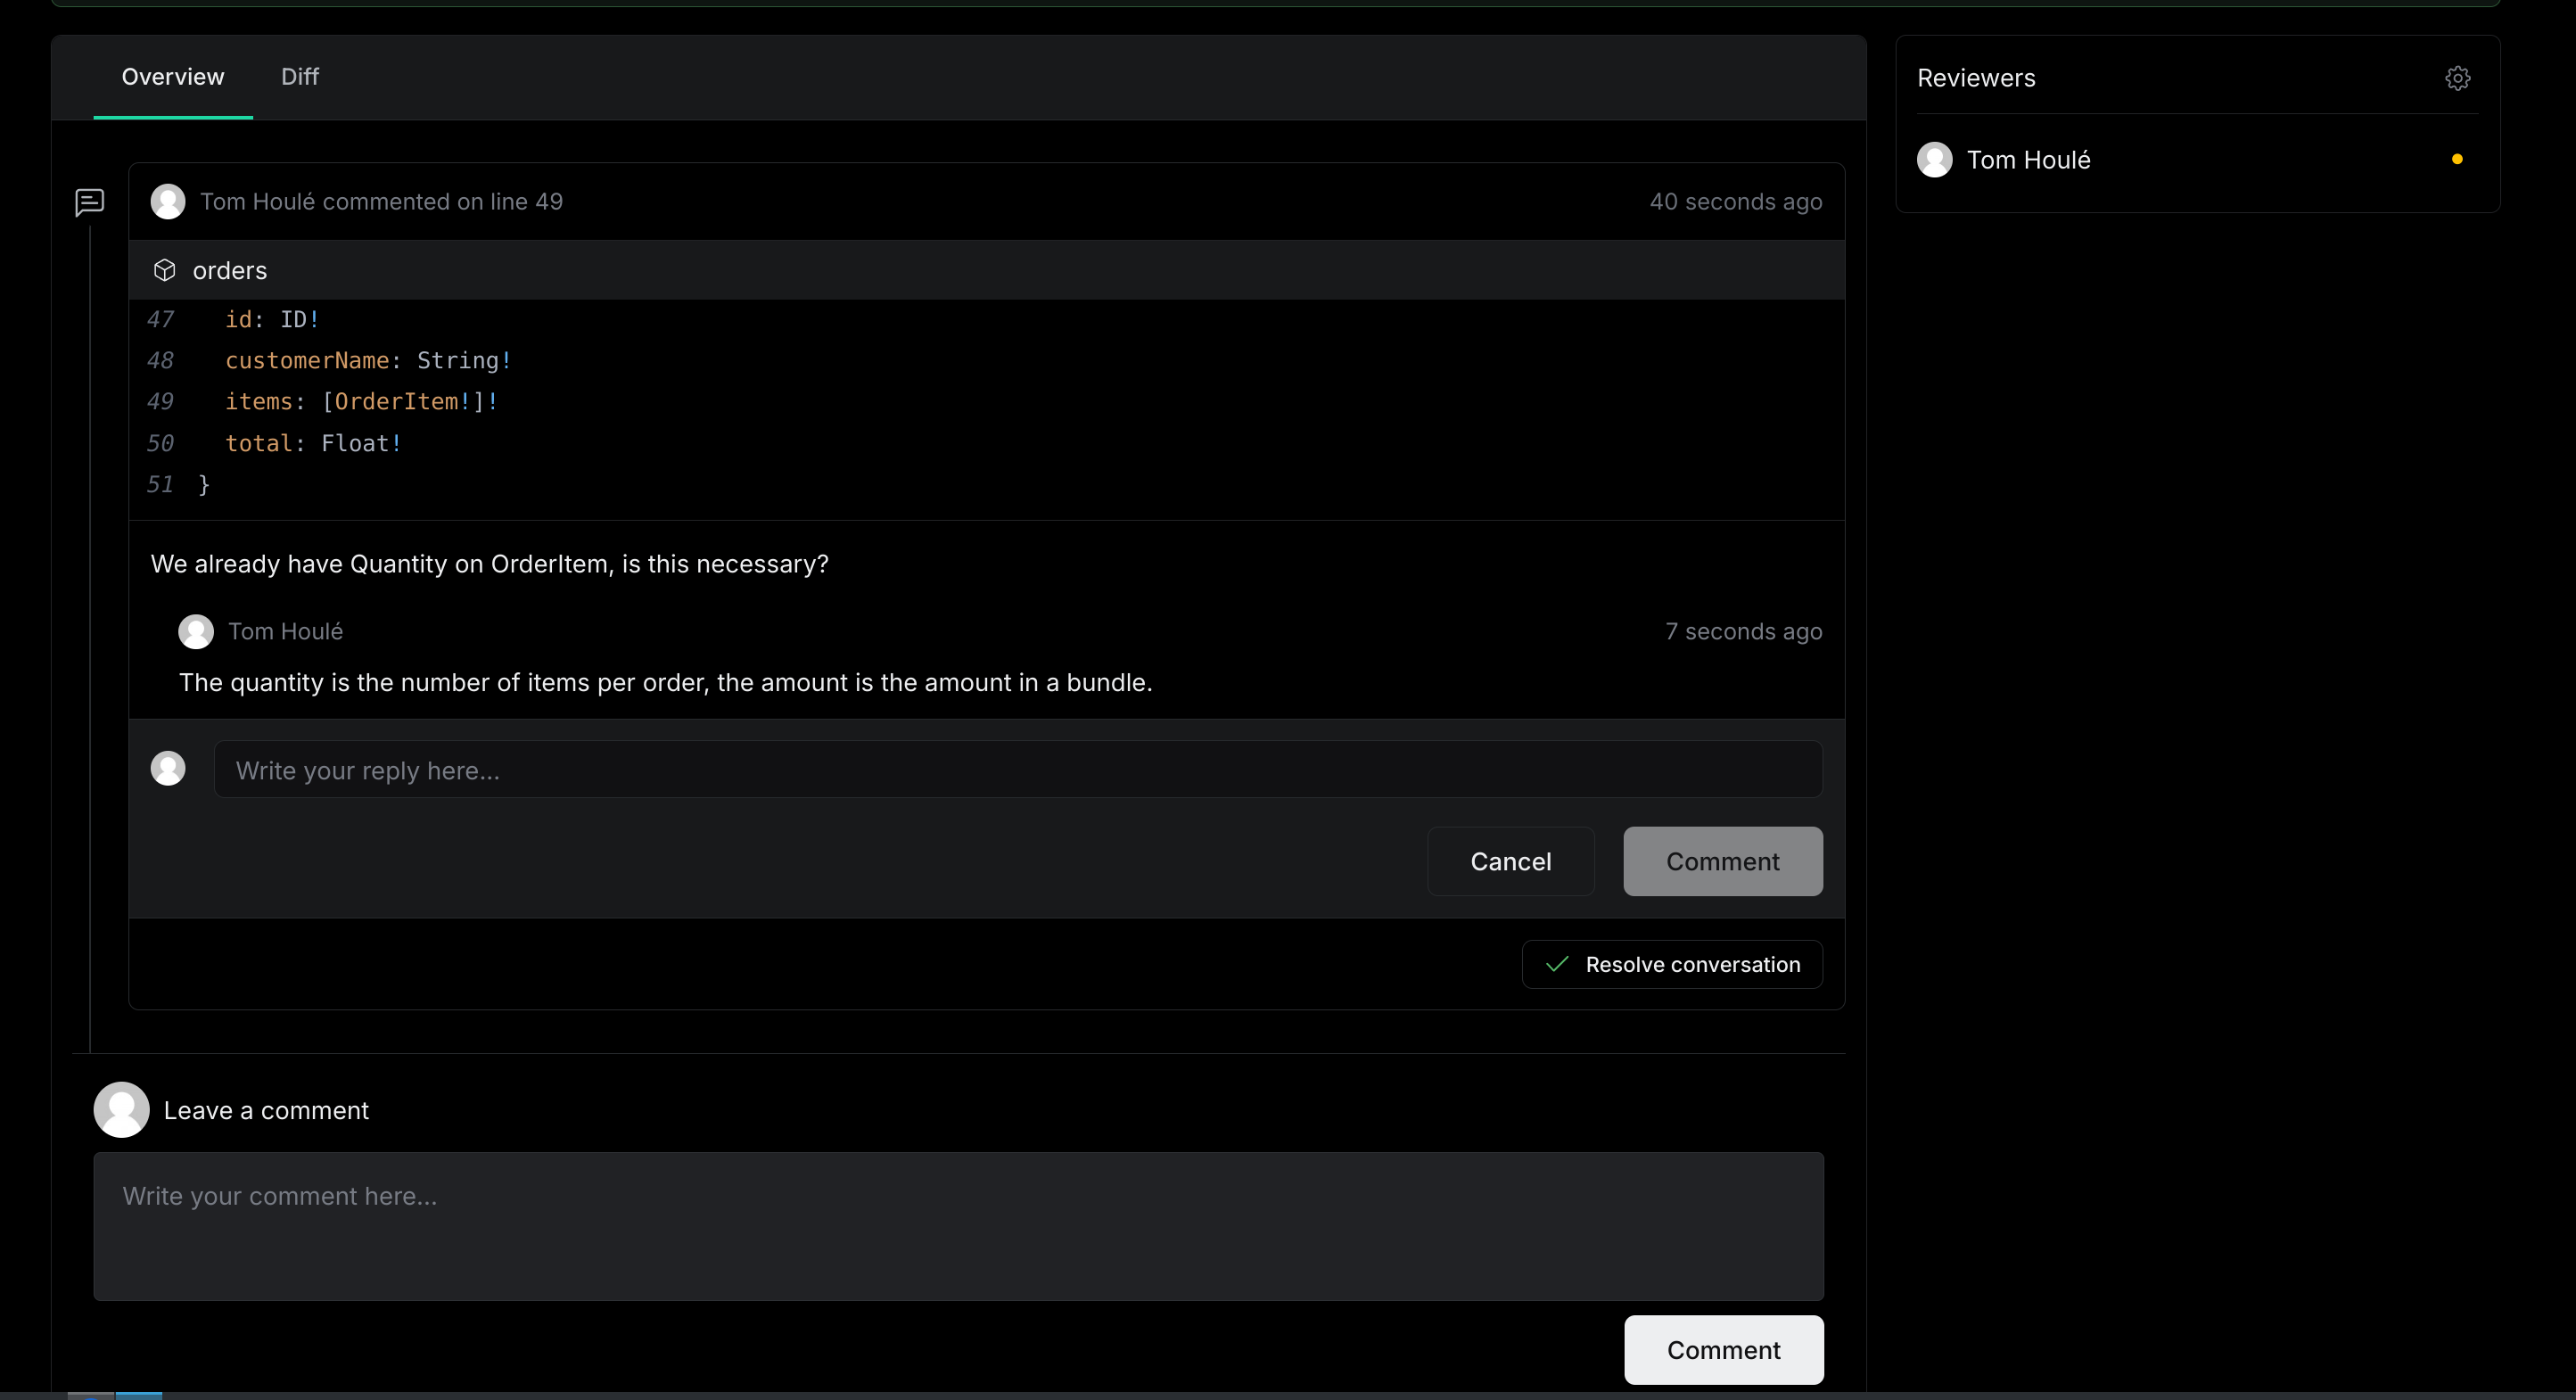
7. **(Reviewers)** The reviewers approve or reject the proposal. Once all required reviewers have approved or rejected, the proposal transitions to the approved or rejected state.
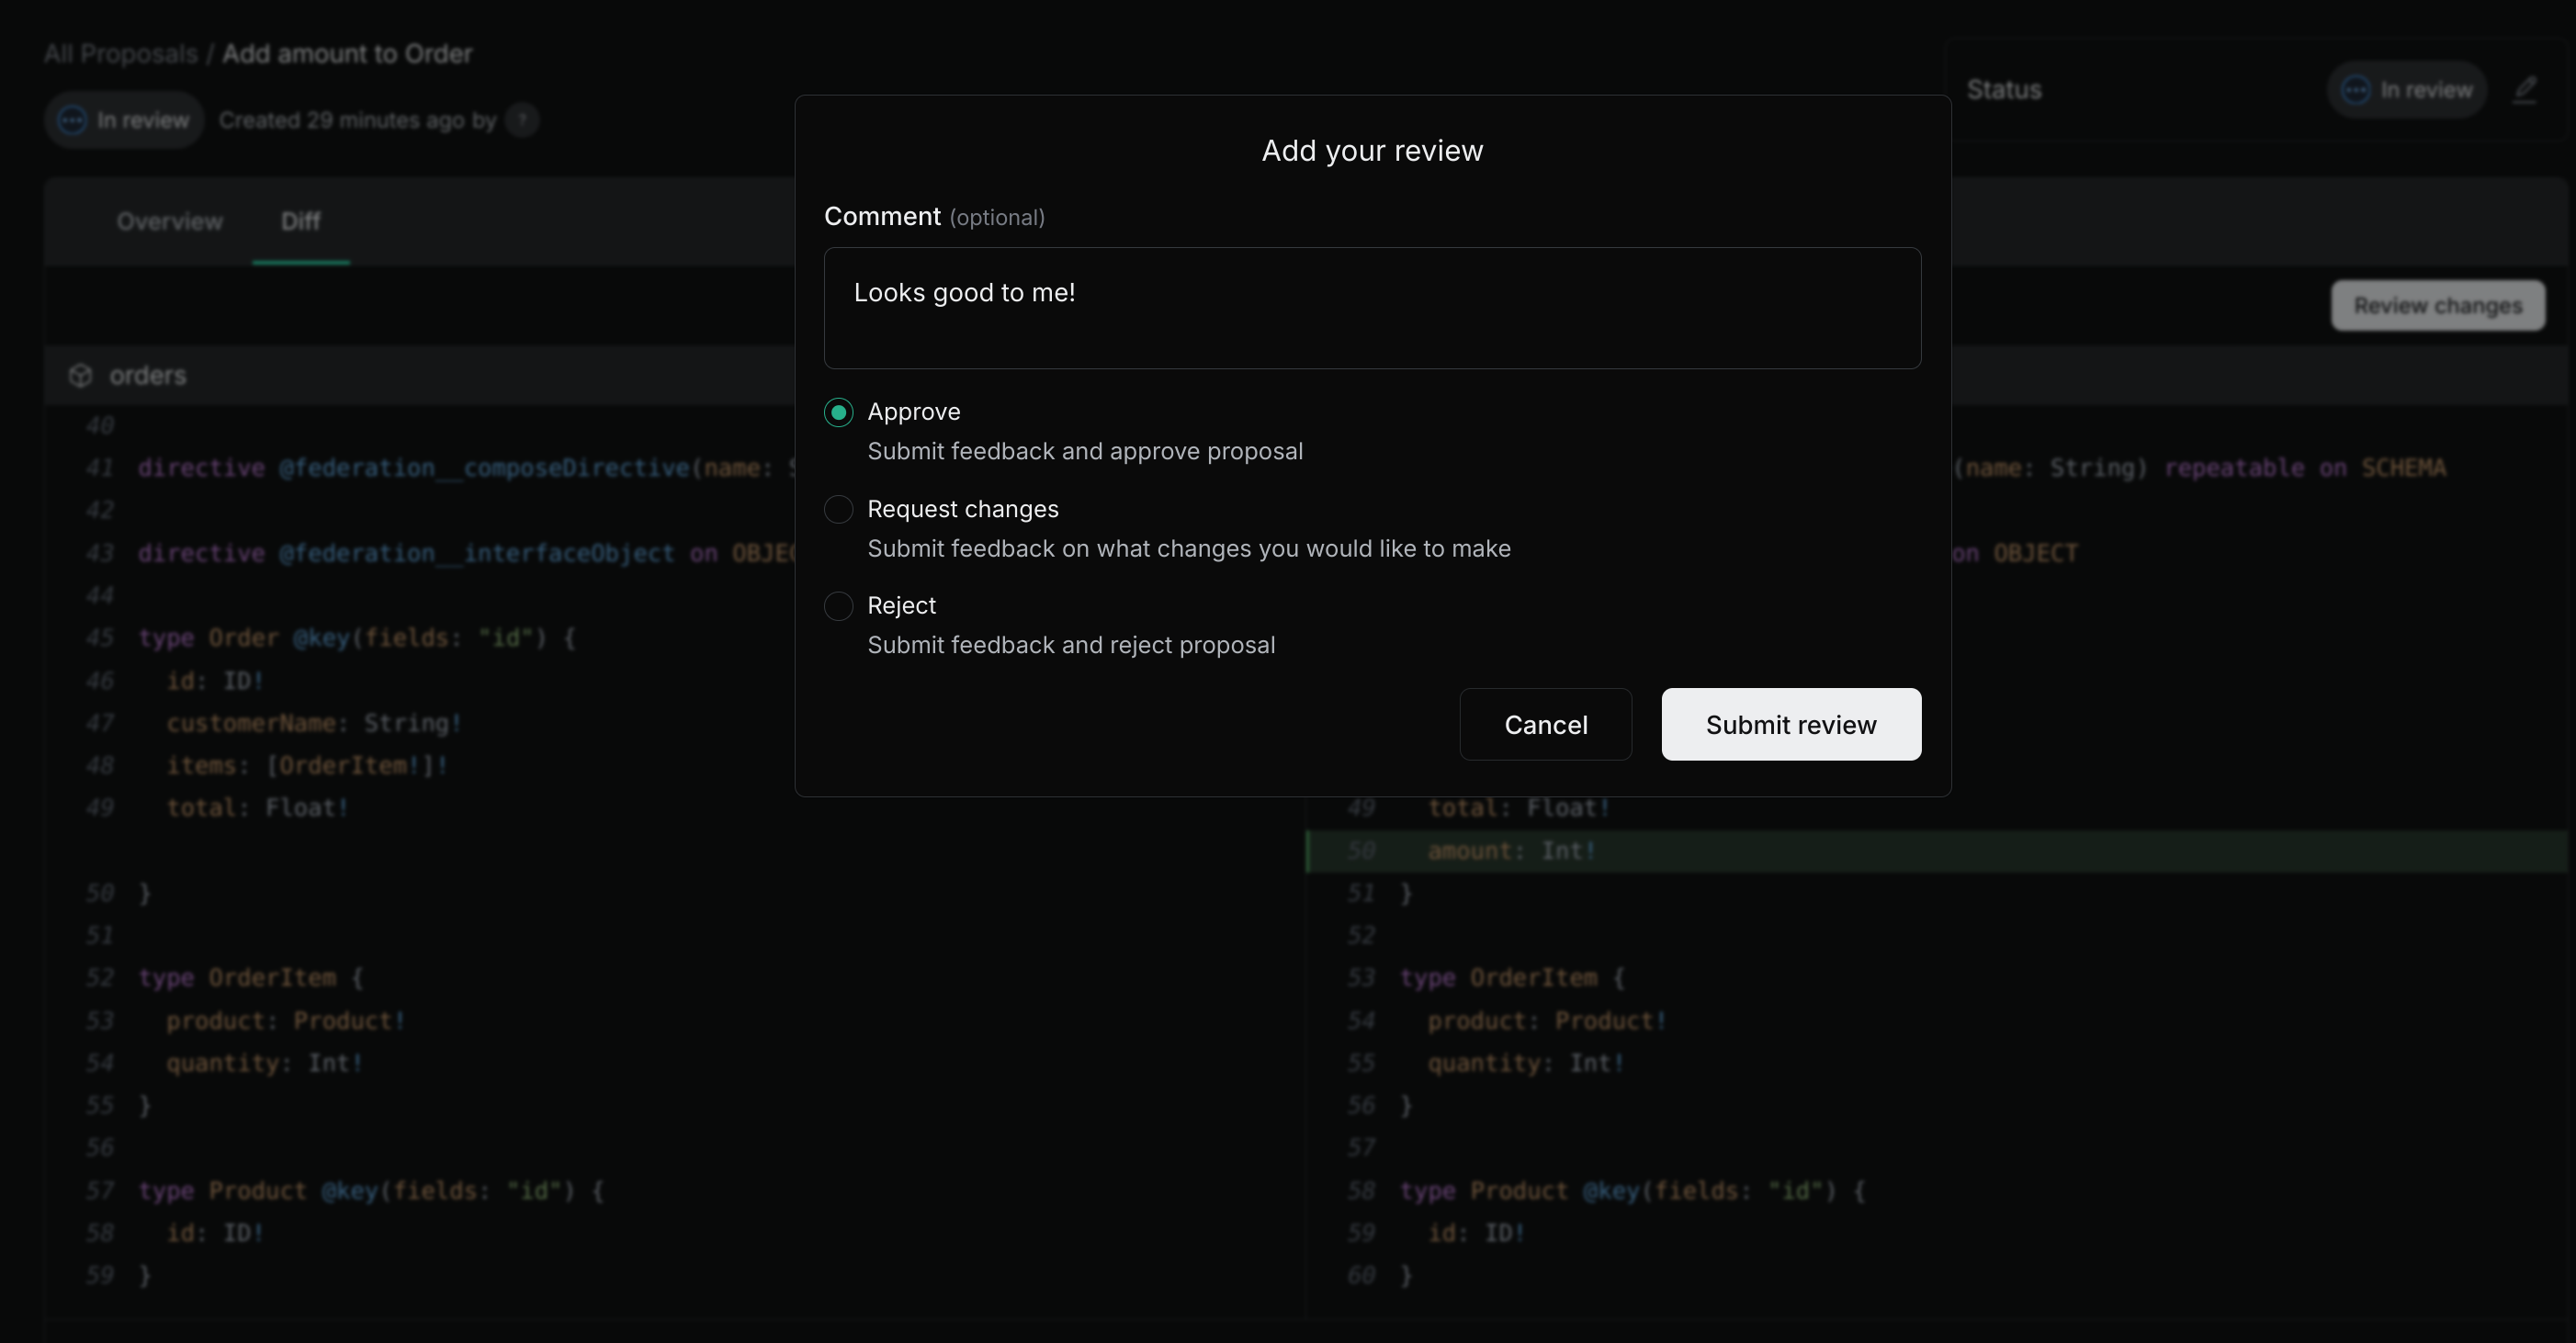
8. **(Subgraph implementer)** New subgraph versions containing changes from any approved proposal can be published. [Schema checks](/docs/platform/schema-checks#proposal-checks) ensure that only approved changes can be published.
## Configuration
By default, schema proposals are not enforced in schema checks and there are no configured reviewers. These options and more can be configured in the Settings tab, under Graph, then Proposals.
## Automatic rebasing
Each time the proposal is edited and changes saved, the proposal is automatically and transparently rebased on top of the latest published version of each subgraph schema. Schema proposals are better thought of as a set of diffs rather than full schema strings. When you start a new edit on an existing proposal, the schema you see is the latest version, with the current diff for the proposal applied on top of it.
---
# Platform - Schema Registry
The Schema Registry tracks published schemas and helps you evolve your APIs with [Schema Checks](/docs/platform/schema-checks). Use the CLI and Grafbase dashboard to interact with the registry.
## Managing a Federated Graph
In a federated graph, the schema registry tracks published subgraphs. The schema registry uses this tracking to:
- Compose subgraph schemas into a federated graph schema
- Help you evolve schemas individually and as a group (see [Schema checks](/docs/platform/schema-checks))
Each branch of a federated graph contains its own set of subgraphs. Each subgraph represents a live, deployed GraphQL endpoint that you can manage on Grafbase or deploy anywhere else.
The schema registry views each subgraph as a record with these properties:
- `name`: The identifier for a subgraph within a branch. It corresponds to the `--name` argument in the CLI publish and check commands. The schema and subgraph URL can change, but the name remains the same.
- `url`: The endpoint where the subgraph runs. It corresponds to the `--url` argument of the CLI publish command.
- `schema`: The GraphQL schema of the subgraph. It corresponds to the `--schema` argument of the CLI command.
The schema registry tracks published subgraphs, their names, URLs and schemas. After each change, it attempts to _compose_ the subgraphs into a federated graph.
## Publishing a Subgraph
The schema registry composes the federated graph's schema from subgraph schemas. To update the federated graph's schema, publish your subgraphs.
Read more on publishing from the [reference documentation](/docs/cli/commands/publish).
### Publish Workflow
We recommend publishing a subgraph schema each time you deploy a new version of the subgraph. You can publish an unchanged schema multiple times safely without side effects.
As described in [composition](#schema-composition), publishing an updated subgraph schema can have these effects:
- If composition fails, your federated graph's schema doesn't update until you fix the composition errors.
- If composition succeeds, the federated graph's schema updates but your changes might break existing clients (for example, when you remove a field or change its type).
Use [Schema Checks](/docs/platform/schema-checks) to verify that publishing your new or updated schema is safe.
### Schema Composition
When you [publish](#publishing-a-subgraph) a subgraph, the registry attempts to compose it with all other subgraphs published in the branch.
When composition succeeds, it creates a new federated graph schema. The router uses that schema as the new public facing API for the federated graph.
When composition fails, the federated graph continues running with the previous working federated schema. The branch enters a state where the subgraphs don't compose. You'll see composition errors and hints about how to fix them on each new publish and check, until the subgraph schemas compose without error.
Publishing succeeds even when it creates composition errors and puts a branch in a failing state, because valid migration workflows require this behavior.
For example, when you move a type from subgraph A to subgraph B, you can use this zero downtime, non-breaking migration path that temporarily prevents the subgraphs from composing:
1. Add the type to subgraph B.
2. Publish and deploy subgraph B.
3. Delete the type from subgraph A.
4. Publish and deploy subgraph A.
Between steps 2 and 4, the branch won't compose because multiple subgraphs own the type, but subgraph A continues to serve queries for the type.
## Listing Subgraphs
Use the `grafbase subgraphs` command to list published subgraphs in a branch.
Example:
```bash
grafbase subgraphs tomhoule/schema-check-action-federated-graph-example@main
Subgraphs:
- manufacturing
- retail
```
## Inspecting Schemas
Use the `grafbase schema` command to inspect subgraph and federated graph schemas.
To view a specific subgraph's GraphQL schema, use the `--name` argument:
```bash
grafbase schema tomhoule/schema-check-action-federated-graph-example@main --name retail
# < prints the whole GraphQL schema >
```
The CLI prints the composed schema of the federated graph when you omit the `--name` argument.
## Changelog
View changes to schemas and public API in your graph from the Changelog tab in the dashboard. The Changelog shows an overview of GraphQL API schema changes for each deployment.
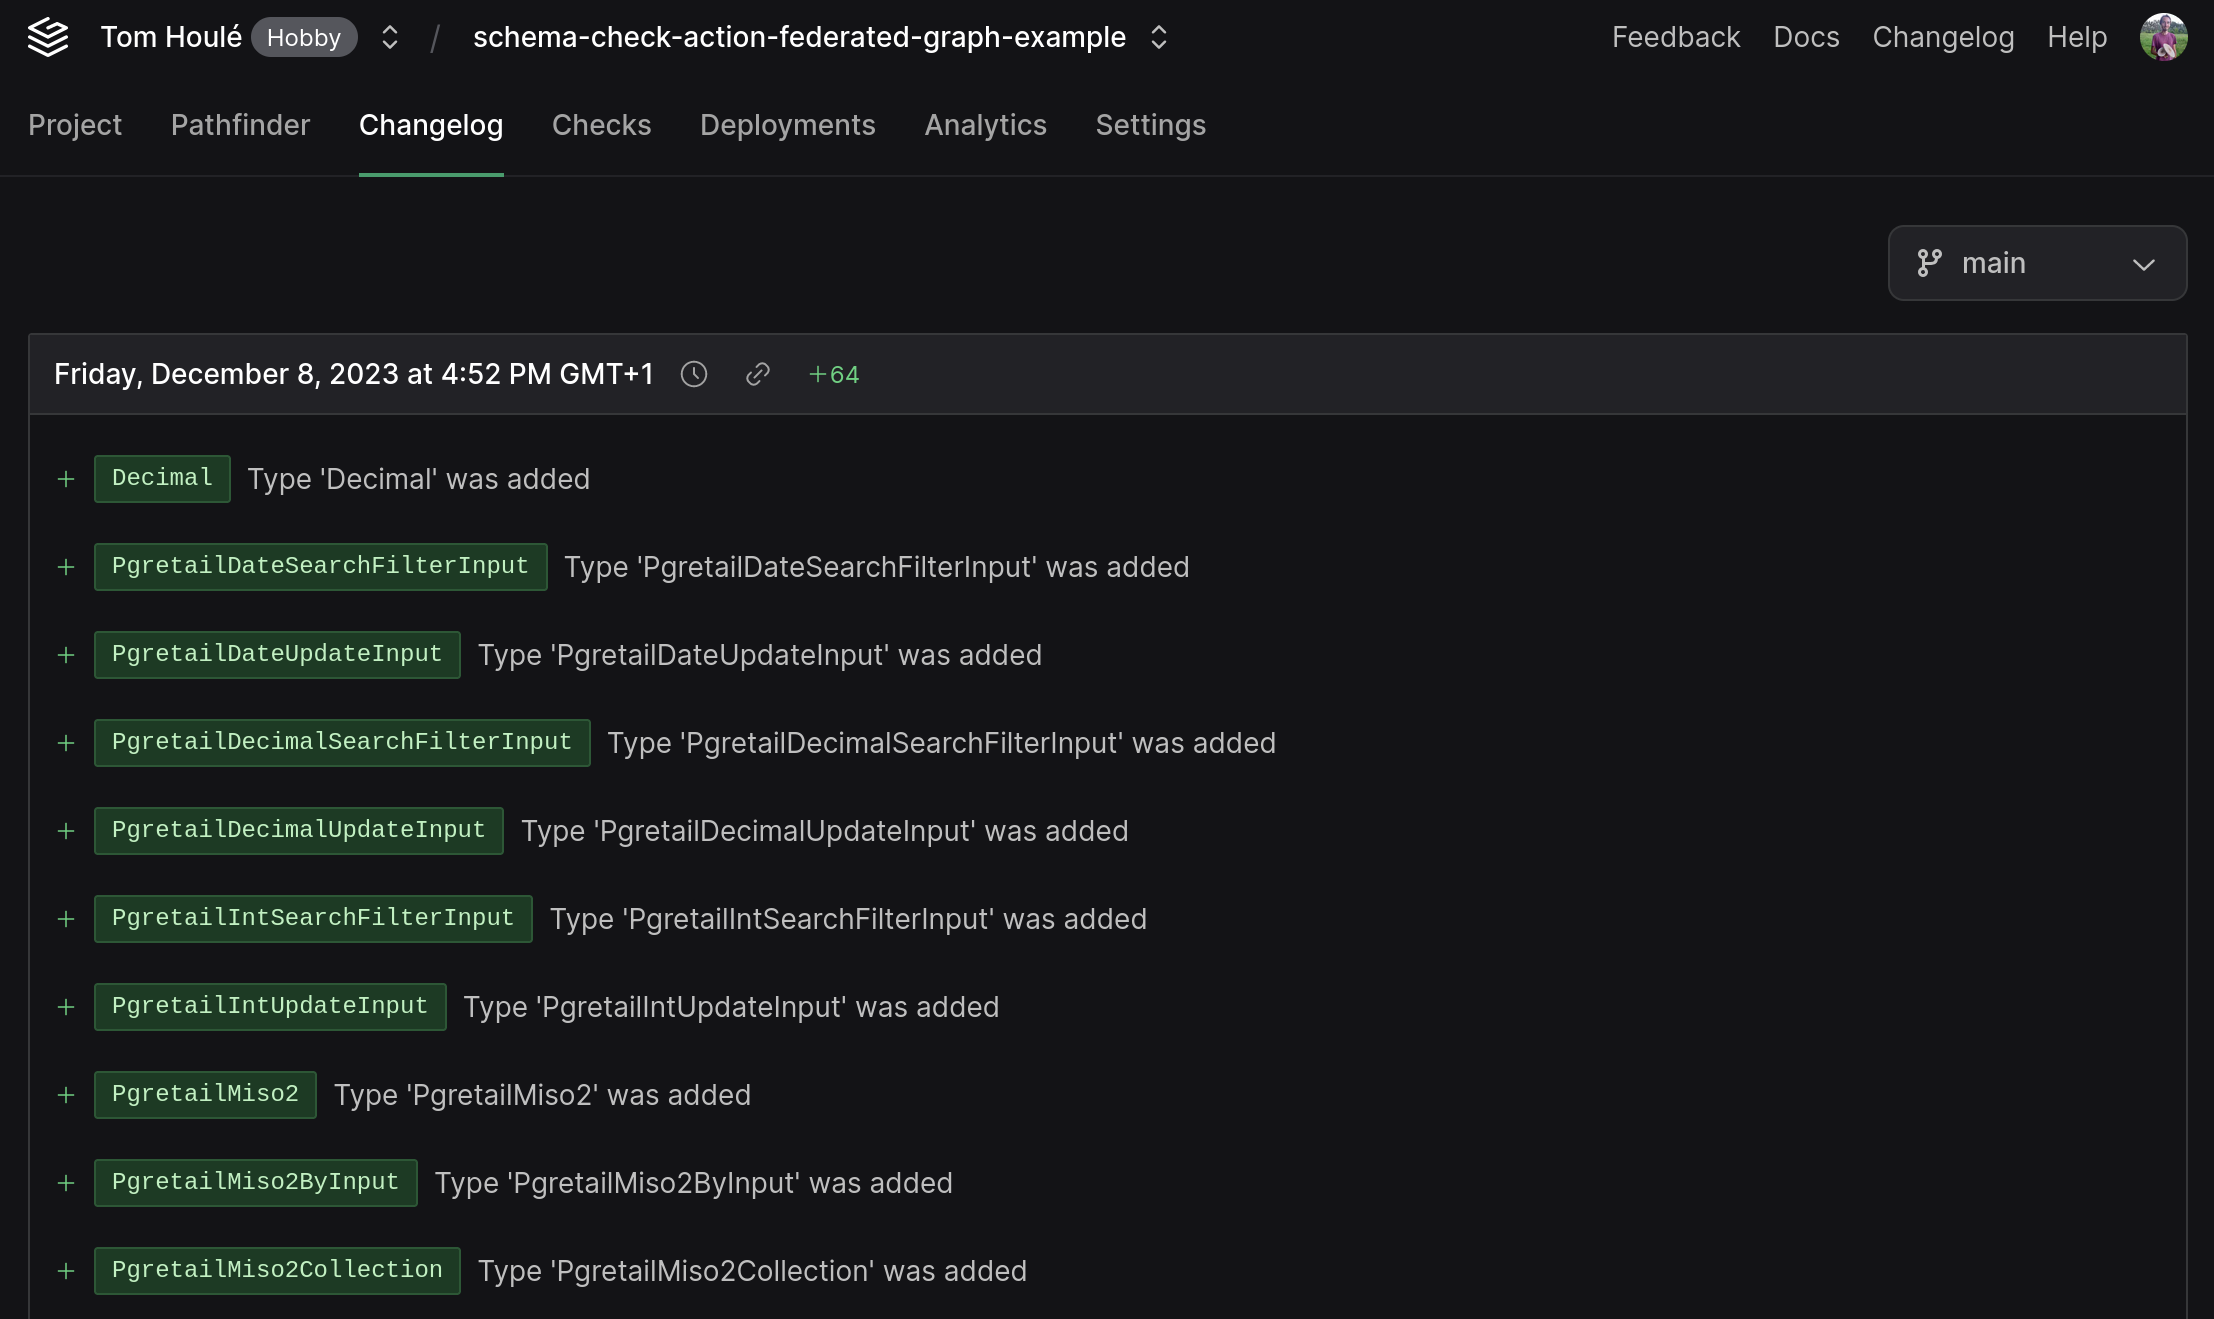
---
# Platform - Self-Hosting
Grafbase Enterprise Platform is a self-hosted version of the Grafbase platform, which is suitable for enterprises that are subject to regulatory compliance. It runs in your infrastructure and is governed by your own access and security controls.

## Architecture
The Grafbase Enterprise Platform is composed of the following components:
- **Grafbase API**: The management API of the platform.
- **Grafbase Dashboard**: Web-based interface to manage graphs and access analytics.
- **Telemetry Sink**: Collects telemetry data from the Grafbase Gateway and writes it to Kafka.
In addition to these components, Grafbase Enterprise Platform requires the following services:
- **Postgres**: Database that contains core platform data.
- **ClickHouse**: Database that contains analytics data.
- **Zitadel**: Authentication management to manage users and permissions.
- **MinIO**: Storage provider to store published schemas and trusted documents.
- **Kafka**: Message broker to handle real-time telemetry data.
- **OpenTelemetry Collector**: Aggregates telemetry data from Kafka to ClickHouse.
## Helm Charts
The Grafbase Enterprise Platform is distributed via Helm charts that can be installed on any Kubernetes cluster. The Helm charts let you to decide which components you want from the Enterprise Platform.
To get access to the Helm charts please [contact us](/contact) and we will provide you with the necessary credentials.
---
# Platform - Self-Hosting - Installation
The Grafbase Enterprise Platform is distributed as a Helm chart that can be installed on any Kubernetes cluster. Please [contact sales](/contact/sales) to get the needed credentials to access the charts and container images.
## Prerequisites
Before you start the installation, make sure you have the following prerequisites:
- A Kubernetes cluster with at least 4 CPU and 8 GB of memory.
- Helm 3 installed on your local machine.
- Helmfile installed on your local machine.
- Kubernetes CLI installed on your local machine.
## Installation
The Grafbase Helm chart is hosted on our private repository. To install the Grafbase Enterprise Platform, you need to add the repository to your Helm configuration:
```bash
helm registry login helm.grafbase.com --username --password-stdin
```
The next step is to create a Kubernetes namespace for the Enterprise Platform. When done, you can start defining the helmfile configuration:
```yaml
releases:
- name: enterprise-platform
chart: oci://helm.grafbase.com/enterprise-platform/stable/enterprise-platform
version:
namespace: default
createNamespace: true
values:
- ./values.yaml.gotmpl
secrets:
- ./secrets.yaml
```
The `values.yaml.gotmpl` and `secrets.yaml` files should be created in the same directory as the helmfile configuration. The `values.yaml.gotmpl` file should contain the configuration for the Grafbase Enterprise Platform, and the `secrets.yaml` file should contain the secrets for the platform.
The first thing is to define the services that you want to install to the Grafbase Enterprise Platform cluster. To start, you can enable all services to play with the cluster:
```yaml
global:
zitadel:
enabled: true
postgres:
enabled: true
clickhouse:
enabled: true
minio:
enabled: true
kafka:
enabled: true
telemetrySink:
enabled: true
otelCollector:
enabled: true
dashboard:
enabled: true
```
In a production environment, you might want to disable some services that you don't need. In general it is advised to have at least the following services enabled:
- **API**: The core API of the platform. ([configuration values](/docs/platform/self-hosting/charts/api))
- **Dashboard**: Allows you to manage your graphs from the browser. ([configuration values](/docs/platform/self-hosting/charts/dashboard))
- **Telemetry Sink**: Collects telemetry data from the Grafbase Gateway. ([configuration values](/docs/platform/self-hosting/charts/telemetry-sink))
- **OpenTelemetry Collector**: Aggregates telemetry data from Kafka to ClickHouse. ([configuration values](/docs/platform/self-hosting/charts/otel-collector))
- **Zitadel**: The identity provider for the platform ([configuration values](/docs/platform/self-hosting/charts/zitadel))
Additionally, you might want to enable the following services:
- **Postgres**: Database that stores the core platform data. ([configuration values](/docs/platform/self-hosting/charts/postgres))
- **ClickHouse**: Database that stores the analytics data. ([configuration values](/docs/platform/self-hosting/charts/clickhouse))
- **MinIO**: Object storage that stores the platform files. ([configuration values](/docs/platform/self-hosting/charts/minio))
- **Kafka**: Message broker that stores the telemetry data. ([configuration values](/docs/platform/self-hosting/charts/kafka))
## CLI Setup
By default, the [Grafbase CLI](/docs/cli/installation) uses the Grafbase Cloud Platform. To use the Grafbase Enterprise Platform, you need to configure the CLI to use your platform. You can do this by defining the URL to your local installation in the CLI login command:
```bash
grafbase login --url https://
```
After logging in, you can use the CLI to interact with your Grafbase Enterprise Platform installation.
## Gateway Setup
The [Grafbase Gateway](/docs/gateway/installation) uses the Enterprise Platform to store telemetry data for the analytics and tracing dashboards.
Additionally, the Enterprise Platform is responsible for composing subgraph schemas. The latest federated graph schema (supergraph schema) for a graph can be fetched using the Grafbase CLI:
Assuming you have logged in interactively with `grafbase login` using the `--url` argument to point to your own instance of the enterprise platform, you can run:
```bash
grafbase schema account-name/graph-name@branch-name
```
In a non-interactive environment (like CI), you can use the `GRAFBASE_API_URL` and `GRAFBASE_ACCESS_TOKEN` environment variables:
```bash
GRAFBASE_ACCESS_TOKEN="..." GRAFBASE_API_URL=https://api.grafbase.com/graphql grafbase schema account-name/graph-name@branch-name
```
Replace `api.grafbase.com` with the address of your instance of the enterprise platform, as well as the account and graph name in the example above. The branch name is optional, and will default to the production branch of the graph. The token in `GRAFBASE_ACCESS_TOKEN` must be authorized for the specific graph or have full access to the organization.
You can then start the Gateway with the downloaded schema:
```bash
grafbase schema account-name/graph-name@branch-name > schema.graphql
GRAFBASE_OTEL_URL=https://custom-telemetry-sink-deployment.dev grafbase-gateway --schema ./schema.graphql --config grafbase.toml
```
Note that you must change the telemetry sink URL by setting the `GRAFBASE_OTEL_URL` environment variable in the Grafbase Gateway deployment to the URL of the [Telemetry Sink chart](/docs/platform/self-hosting/charts/telemetry-sink).
The Gateway watches the schema file for changes, so if you update it in your filesystem, or for example as part of a Kubernetes ConfigMap, the gateway will automatically pick up the new schema and serve new requests with it, without restarting or losing state.
---
# Platform - Self-Hosting - Charts - API
This reference documents the Kubernetes configuration options for the Grafbase API, which provides a GraphQL interface to the Grafbase platform. The chart provides all the needed services to run the API, including ClickHouse, PostgreSQL, MinIO S3 API, and Zitadel.
Remember that an error in the API service health check occurs when ClickHouse, PostgreSQL, or the S3 bucket is unavailable or incorrectly configured.
## image
[Kubernetes Image Pull Policy](https://kubernetes.io/docs/concepts/containers/images/#updating-images)
**Defaults**:
```yaml
image:
# Controls container image pulls
pullPolicy: IfNotPresent
# Container image repository
repository: docker.grafbase.com/proxy/enterprise-platform/ghcr.io/grafbase/api
# Image tag to use
tag: latest
```
## autoscaling
[Kubernetes Horizontal Pod Autoscaler](https://kubernetes.io/docs/tasks/run-application/horizontal-pod-autoscale/)
**Defaults**:
```yaml
autoscaling:
# Enables autoscaling
enabled: true
# Minimum number of replicas
minReplicas: 1
# Maximum number of replicas
maxReplicas: 2
# Target CPU utilization percentage
targetCPUUtilizationPercentage: 50
```
## ingress
[Kubernetes Ingress Docs](https://kubernetes.io/docs/concepts/services-networking/ingress/)
**Defaults**:
```yaml
ingress:
# Enables ingress
enabled: false
# Ingress class
className: 'nginx'
hosts:
# Hostnames and paths for the ingress
- host: api.local
paths:
- path: /*
pathType: ImplementationSpecific
backend:
serviceName: api
servicePort: 8080
```
## serviceAccount
[Kubernetes Service Account Docs](https://kubernetes.io/docs/tasks/configure-pod-container/configure-service-account/)
**Defaults**:
```yaml
serviceAccount:
# Controls service account creation
create: true
# Annotations to add to the service account
annotations: {}
# Service account name. Uses default if not set
name: ''
```
## service
[Kubernetes Service Types](https://kubernetes.io/docs/concepts/services-networking/service/#publishing-services-service-types)
**Defaults**:
```yaml
service:
type: ClusterIP
port: 80
targetPort: 8080
name: http
nodePort: 30080
```
## configmap
Configuration values for the cluster configmap.
**Defaults**:
```yaml
configmap:
# Enables configmap creation and env var mounting
enabled: true
name: ''
values:
# The port the service will expose
PORT_WEB: 8080
# The port the worker service will expose
PORT_WORKER: 8080
# Logging level configuration
RUST_LOG: info
# Connection URL for ClickHouse database
CLICKHOUSE_URL: clickhouse://grafbase-enterprise-platform-clickhouse:9000
# ClickHouse database name
CLICKHOUSE_DB: analytics
# ClickHouse username
CLICKHOUSE_USER: grafbase
# ClickHouse connection timeout in seconds
CLICKHOUSE_TIMEOUT_SECS: 5
# Maximum number of PostgreSQL connections
PG_MAX_CONNECTIONS: 10
# Minimum number of PostgreSQL connections
PG_MIN_CONNECTIONS: 1
# PostgreSQL connection timeout in seconds
PG_CONNECT_TIMEOUT_SECS: 1
# PostgreSQL connection acquisition timeout in seconds
PG_ACQUIRE_TIMEOUT_SECS: 1
# PostgreSQL idle connection timeout in seconds
PG_IDLE_TIMEOUT_SECS: 300
# Maximum lifetime of PostgreSQL connections in seconds
PG_CONNECTION_MAX_LIFETIME_SECS: 3600
# URL for runtime assets storage, in particular federated schemas. Use "AwsS3" for AWS S3, "CloudflareR2" for Cloudflare R2,
# or a custom url for any other compatible object storage provider.
RUNTIME_ASSETS_STORAGE: http://grafbase-enterprise-platform-minio:9000
# The access key id for the AWS S3 bucket containing runtime assets (federated schemas and trusted documents).
AWS_ACCESS_KEY_ID: changeme
# The region of the runtime assets bucket
AWS_REGION: us-east-1
# Name of the bucket in RUNTIME_ASSETS_STORAGE where schemas and trusted documents will be stored.
AWS_S3_BUCKET_NAME: grafbase
# Enable or disable tracing
ENABLE_TRACING: true
# The base URL to use for links for Slack notifications and invite emails. Should point to the Grafbase dashboard.
FRONTEND_URL: https://app.grafbase.com
# Allowed CORS origins for the API
CORS_ALLOWED_ORIGINS: "https://grafbase.com,https://app.grafbase.com"
```
## secrets
Configuration values for the cluster secret.
**Defaults**:
```yaml
secrets:
# Enables secret creation and env var mounting
enabled: true
name: ''
values:
# The secret key for symmetric encryption (access tokens)
SYMMETRIC_ENCRYPTION_SECRET: thisisaverysecurekeythatis32byte
# Password for ClickHouse database access
CLICKHOUSE_PASSWORD: grafbase
# PostgreSQL database connection string
PG_CONNECTION_STRING: postgresql://postgres:grafbase@grafbase-enterprise-platform-postgresql:5432/grafbase
# The access key secret for the runtime assets bucket.
AWS_SECRET_ACCESS_KEY: changeme
```
## worker
Configuration values for the API background worker worker.
**Defaults**:
```yaml
worker:
replicaCount: 1
port: 8080
resources: {}
```
---
# Platform - Self-Hosting - Charts - Dashboard
This reference documents the Kubernetes configuration options for the Grafbase Dashboard, which provides a web-based interface to manage your federated graph.
## replicaCount
[Kubernetes ReplicationController Docs](https://kubernetes.io/docs/concepts/workloads/controllers/replicationcontroller/)
**Defaults**:
```yaml
replicaCount: 1
```
## serviceAccount
[Kubernetes Service Account Docs](https://kubernetes.io/docs/tasks/configure-pod-container/configure-service-account/)
**Defaults**:
```yaml
serviceAccount:
# Controls service account creation
create: true
# Annotations to add to the service account
annotations: {}
# Service account name. Uses default if not set
name: ''
```
## service
[Kubernetes Service Types](https://kubernetes.io/docs/concepts/services-networking/service/#publishing-services-service-types)
**Defaults**:
```yaml
service:
# Either ClusterIP, NodePort, ExternalName, or LoadBalancer
type: ClusterIP
# Port to expose
port: 8080
# Target port
targetPort: 8080
# Name of the service
name: http
# The node port to use
nodePort: 30081
```
## ingress
```yaml
ingress:
# Enables ingress
enabled: false
# Ingress class
className: 'nginx'
hosts:
# Hostnames and paths for the ingress
- host: dashboard.local
paths:
- path: /*
pathType: ImplementationSpecific
backend:
serviceName: dashboard
servicePort: 8080
```
## autoscaling
[Kubernetes Horizontal Pod Autoscaler](https://kubernetes.io/docs/tasks/run-application/horizontal-pod-autoscale/)
**Defaults**:
```yaml
autoscaling:
# Enables autoscaling
enabled: true
# Minimum number of replicas
minReplicas: 1
# Maximum number of replicas
maxReplicas: 2
# Target CPU utilization percentage
targetCPUUtilizationPercentage: 50
```
## configmap
Configuration values for the cluster configmap.
```yaml
configmap:
# Enable or disable the ConfigMap. Enabling will create a configmap with the given values and then mounted as env vars in the deployment.
enabled: true
# Cluster configmap to reference and mount its contents as environment variables.
name: ''
# Key-value pairs for configuration.
values:
# The port the service will expose.
PORT: 8080
# The host of the Grafbase API.
GRAFBASE_API_HOST: http://localhost:30080
```
## secrets
Configuration values for the cluster secret.
```yaml
secrets:
# Enable or disable the Secret. Enabling will create a secret with the given values and then mounted as env vars in the deployment.
enabled: true
name: ''
values:
# The secret key for session encryption. Must be the same in the API, and in the telemetry sink.
SESSION_ENCRYPTION_KEY: ASecretEncryptionKeyAtLeast32chars
```
---
# Platform - Self-Hosting - Charts - Telemetry Sink
This reference documents the Kubernetes configuration options for the Telemetry Sink, which authorizes and collects telemetry data from the platform and sends it to the message broker.
## replicaCount
[Kubernetes ReplicationController Docs](https://kubernetes.io/docs/concepts/workloads/controllers/replicationcontroller/)
**Defaults**:
```yaml
replicaCount: 1
```
## serviceAccount
[Kubernetes Service Account Docs](https://kubernetes.io/docs/tasks/configure-pod-container/configure-service-account/)
**Defaults**:
```yaml
serviceAccount:
# Controls service account creation
create: true
# Annotations to add to the service account
annotations: {}
# Service account name. Uses default if not set
name: ''
```
## service
[Kubernetes Service Types](https://kubernetes.io/docs/concepts/services-networking/service/#publishing-services-service-types)
**Defaults**:
```yaml
service:
# Service type (e.g. ClusterIP, NodePort, LoadBalancer)
type: ClusterIP
# Port to expose service on
port: 80
# Port that the service targets on the pods
targetPort: 4317
# Name of the service port
name: http
# Port exposed on each node for NodePort type
nodePort: 30431
```
## ingress
[Kubernetes Ingress Docs](https://kubernetes.io/docs/concepts/services-networking/ingress/)
**Defaults**:
```yaml
ingress:
# Enables ingress
enabled: false
# Ingress class
className: 'nginx'
hosts:
# Hostnames and paths for the ingress
- host: telemetry-sink.local
paths:
- path: /*
pathType: ImplementationSpecific
backend:
serviceName: telemetry-sink
servicePort: 4317
```
## autoscaling
[Kubernetes Horizontal Pod Autoscaler](https://kubernetes.io/docs/tasks/run-application/horizontal-pod-autoscale/)
**Defaults**:
```yaml
autoscaling:
# Enables autoscaling
enabled: true
# Minimum number of replicas
minReplicas: 1
# Maximum number of replicas
maxReplicas: 2
# Target CPU utilization percentage
targetCPUUtilizationPercentage: 50
```
## configmap
Configuration values for the cluster configmap.
**Defaults**:
```yaml
configmap:
# Controls configmap creation
enabled: true
name: ''
values:
# Address and port for the telemetry sink to listen on
GRAFBASE_TELEMETRY_SINK_LISTEN_ADDRESS: 0.0.0.0:4317
# Log level
RUST_LOG: info
# PostgreSQL acquire timeout in seconds
PG_ACQUIRE_TIMEOUT_SECS: 5
# PostgreSQL connect timeout in seconds
PG_CONNECT_TIMEOUT_SECS: 5
# PostgreSQL connection maximum lifetime in seconds
PG_CONNECTION_MAX_LIFETIME_SECS: 3600
# PostgreSQL idle timeout in seconds
PG_IDLE_TIMEOUT_SECS: 300
# PostgreSQL maximum number of connections
PG_MAX_CONNECTIONS: 15
# PostgreSQL minimum number of connections
PG_MIN_CONNECTIONS: 1
# Kafka topic name for metrics
GRAFBASE_OTEL_KAFKA_TOPIC_METRICS: otlp_metrics
# Kafka topic name for traces
GRAFBASE_OTEL_KAFKA_TOPIC_TRACES: otlp_spans
# Kafka topic name for logs
GRAFBASE_OTEL_KAFKA_TOPIC_LOGS: otlp_logs
# Kafka bootstrap server address
GRAFBASE_KAFKA_BOOTSTRAP_SERVERS: grafbase-enterprise-platform-kafka:9092
# Kafka security protocol
GRAFBASE_KAFKA_SECURITY_PROTOCOL: PLAINTEXT
# Kafka authentication mechanism
GRAFBASE_KAFKA_MECHANISM: PLAIN
# Environment name
ENVIRONMENT: production
```
## secrets
Configuration values for the cluster secret.
```yaml
secrets:
# Controls secret creation
enabled: true
# Secret name. Uses default if not set
name: ''
values:
# Secret key used for API access token verification. Must be the same in the API, the dashboard, and the telemetry sink.
GRAFBASE_API_ACCESS_TOKENS_SECRET: thisisaverysecurekeythatis32byte
# PostgreSQL connection string
PG_CONNECTION_STRING: postgresql://postgres:grafbase@grafbase-enterprise-platform-postgresql:5432/grafbase
# Kafka username for authentication
GRAFBASE_KAFKA_USERNAME: grafbase
# Kafka password for authentication
GRAFBASE_KAFKA_PASSWORD: grafbase
# ClickHouse connection string
CLICKHOUSE_CONNECTION_STRING: clickhouse://grafbase-enterprise-platform-clickhouse:9000?database=analytics&x-multi-statement=true&username=grafbase&password=grafbase
```
## migrations
Configuration values for the database migrations.
```yaml
migrations:
clickhouse:
resources:
limits:
cpu: 1000m
memory: 1000Mi
requests:
cpu: 1000m
memory: 1000Mi
image:
pullPolicy: IfNotPresent
repository: docker.grafbase.com/proxy/enterprise-platform/ghcr.io/grafbase/clickhouse-migrations
tag: latest
```
---
# Platform - Self-Hosting - Charts - OpenTelemetry Collector
This reference documents the Kubernetes configuration options for the OpenTelemetry Collector, which aggregates telemetry data from Kafka to ClickHouse.
## replicaCount
[Kubernetes ReplicationController Docs](https://kubernetes.io/docs/concepts/workloads/controllers/replicationcontroller/)
**Defaults**:
```yaml
replicaCount: 1
```
## autoscaling
[Kubernetes Horizontal Pod Autoscaler](https://kubernetes.io/docs/tasks/run-application/horizontal-pod-autoscale/)
**Defaults**:
```yaml
autoscaling:
# Enables autoscaling
enabled: true
# Minimum number of replicas
minReplicas: 1
# Maximum number of replicas
maxReplicas: 2
# Target CPU utilization percentage
targetCPUUtilizationPercentage: 50
```
## extraEnvs
Configuration values for the opentelemetry collector.
**Defaults**:
```yaml
extraEnvs:
- name: KAFKA_BROKER
value: grafbase-enterprise-platform-kafka:9092
- name: KAFKA_USER
value: grafbase
- name: KAFKA_PASSWORD
value: grafbase
- name: KAFKA_SASL_MECHANISM
value: PLAIN
- name: KAFKA_TLS_INSECURE
value: "false"
- name: CLICKHOUSE_ENDPOINT
value: clickhouse://grafbase-enterprise-platform-clickhouse:9000
- name: CLICKHOUSE_DB
value: analytics
- name: CLICKHOUSE_USER
value: grafbase
- name: CLICKHOUSE_PASSWORD
value: grafbase
```
---
# Platform - Self-Hosting - Charts - Zitadel
This reference documents the Kubernetes configuration options for the Zitadel, which provides an identity and access management solution for the Grafbase platform.
All configuration options are nested under the `zitadel` key.
You can find the Zitadel chart source code from the [GitHub repository](https://github.com/zitadel/zitadel-charts/blob/main/charts/zitadel/values.yaml).
## enabled
Enable or disable the Zitadel chart.
**Defaults**:
```yaml
enabled: true
```
## replicaCount
[Kubernetes ReplicationController Docs](https://kubernetes.io/docs/concepts/workloads/controllers/replicationcontroller/)
**Defaults**:
```yaml
replicaCount: 1
```
## resources
Resource requests and limits for the Zitadel container.
**Defaults**:
```yaml
resources:
limits:
cpu: 1000m
memory: 2000Mi
requests:
cpu: 1000m
memory: 1000Mi
```
## setupJob
Resource requests and limits for the Zitadel setup job.
**Defaults**:
```yaml
setupJob:
resources:
limits:
cpu: 1000m
memory: 1000Mi
requests:
cpu: 1000m
memory: 500Mi
```
## zitadel
Zitadel configuration options.
**Defaults**:
```yaml
zitadel:
masterkey: x123456789012345678901234567891y
configmapConfig:
ExternalSecure: false
ExternalDomain: grafbase-enterprise-platform-zitadel
ExternalPort: 30550
TLS:
Enabled: false
Database:
Postgres:
Host: grafbase-enterprise-platform-postgresql
Port: 5432
Database: grafbase
User:
Username: postgres
SSL:
Mode: disable
Admin:
Username: postgres
SSL:
Mode: disable
FirstInstance:
Org:
Machine:
Machine:
Username: zitadel-admin-sa
Name: Admin
MachineKey:
ExpirationDate: '9999-01-01T00:00:00Z'
# Type: 1 means JSON. This is currently the only supported machine key type.
Type: 1
secretConfig:
Database:
postgres:
Host: grafbase-enterprise-platform-postgresql
Port: 5432
Database: grafbase
User:
Username: postgres
Password: grafbase
SSL:
Mode: disable
Admin:
Username: postgres
Password: grafbase
ExistingDatabase: grafbase
SSL:
Mode: disable
```
---
# Platform - Self-Hosting - Charts - Postgres
This reference documents the Kubernetes configuration options for the Postgres chart, which provides a PostgreSQL database for the Grafbase Enterprise Platform.
All configuration options are nested under the `postgresql` key.
You can find the Postgres chart values defined in the [ArtifactHub](https://artifacthub.io/packages/helm/bitnami/postgresql?modal=values).
## global
Global configuration values for the chart.
**Defaults**:
```yaml
global:
imagePullSecrets:
- name: replicated-pull-secret
postgresql:
auth:
postgresPassword: grafbase
```
## auth
Authentication configuration for the Postgres database.
**Defaults**:
```yaml
auth:
enablePostgresUser: true
postgresPassword: grafbase
password: grafbase
database: grafbase
```
## commonAnnotations
Common annotations for the Postgres resources.
**Defaults**:
```yaml
commonAnnotations:
'helm.sh/hook': pre-install
'helm.sh/hook-weight': '-15'
```
## primary
Primary configuration for the Postgres database.
**Defaults**:
```yaml
primary:
resources:
limits:
cpu: 2000m
memory: 2000Mi
requests:
cpu: 2000m
memory: 2000Mi
```
---
# Platform - Self-Hosting - Charts - ClickHouse
This reference documents the Kubernetes configuration options for the ClickHouse chart, which provides an analytics database for the Grafbase Enterprise Platform.
All configuration options are nested under the `clickhouse` key.
You can find the ClickHouse chart source code from the [ArtifactHub](https://artifacthub.io/packages/helm/bitnami/clickhouse?modal=values).
## zookeeper
Zookeeper configuration for the ClickHouse cluster.
**Defaults**:
```yaml
zookeeper:
enabled: false
```
## shards
Number of shards for the ClickHouse cluster.
**Defaults**:
```yaml
shards: 1
```
## replicaCount
[Kubernetes ReplicationController Docs](https://kubernetes.io/docs/concepts/workloads/controllers/replicationcontroller/)
**Defaults**:
```yaml
replicaCount: 1
```
## initdbScripts
List of scripts to run during the ClickHouse initialization.
**Defaults**:
```yaml
initdbScripts:
create_database.sh: |
#!/bin/bash
clickhouse-client --user "$CLICKHOUSE_ADMIN_USER" --password "$CLICKHOUSE_ADMIN_PASSWORD" --query "CREATE DATABASE IF NOT EXISTS analytics;"
```
## auth
Authentication configuration for the ClickHouse database.
**Defaults**:
```yaml
auth:
username: grafbase
password: grafbase
```
## commonAnnotations
[Kubernetes Common Annotations](https://kubernetes.io/docs/concepts/overview/working-with-objects/annotations/)
**Defaults**:
```yaml
commonAnnotations:
'helm.sh/hook': pre-install
'helm.sh/hook-weight': '-15'
```
## resources
Resource requests and limits for the ClickHouse container.
**Defaults**:
```yaml
resources:
requests:
cpu: 1
memory: 1024Mi
limits:
cpu: 1
memory: 2048Mi
```
---
# Platform - Self-Hosting - Charts - Minio
This reference documents the Kubernetes configuration options for the Minio chart, which provides an S3 compatible object storage solution for the Grafbase platform.
All configuration options are nested under the `minio` key.
You can find the Minio chart source code from the [ArtifactHub](https://artifacthub.io/packages/helm/bitnami/minio?modal=values).
## auth
Authentication configuration for the Minio object storage.
**Defaults**:
```yaml
auth:
rootUser: grafbase
rootPassword: grafbase
```
## defaultBuckets
List of default buckets to create during the Minio initialization.o
**Defaults**:
```yaml
defaultBuckets: grafbase
```
---
# Platform - Self-Hosting - Charts - Kafka
This reference documents the Kubernetes configuration options for the Kafka chart, which provides a message bus to store telemetry data for the Grafbase platform.
All configuration options are nested under the `kafka` key.
You can find the Kafka chart source code from the [ArtifactHub](https://artifacthub.io/packages/helm/bitnami/kafka?modal=values).
## zookeeper
Zookeeper configuration for the Kafka cluster.
**Defaults**:
```yaml
zookeeper:
enabled: false
```
## broker
Broker configuration for the Kafka cluster.
**Defaults**:
```yaml
broker:
autoscaling:
enabled: false
```
## resources
Resource requests and limits for the Kafka container.
**Defaults**:
```yaml
resources:
limits:
cpu: 500m
memory: 500Mi
requests:
cpu: 500m
memory: 500Mi
```
## listeners
Listeners configuration for the Kafka cluster.
**Defaults**:
```yaml
listeners:
client:
protocol: PLAINTEXT
interbroker:
protocol: PLAINTEXT
```
## provisioning
Provisioning configuration for the Kafka cluster.
**Defaults**:
```yaml
provisioning:
enabled: true
topics:
- name: otlp_metrics
- name: otlp_spans
- name: otlp_logs
```
## auth
Authentication configuration for the Kafka cluster.
**Defaults**:
```yaml
auth:
clientProtocol: PLAIN
interBrokerProtocol: PLAIN
sasl:
jaas:
clientUsers:
- grafbase
clientPasswords:
- grafbase
```
---
# Platform - Self-Hosting - Release notes - v0.6.6
April 28, 2025
## Dependency Updates
- Update external charts to latest:
- postgresql 16.6.6
- minio 16.0.8
- clickhouse 9.2.0
- zitadel 8.13.1
- kafka 32.2.1
- opentelemetry-collector 0.122.3
## Fixes
- Update container name to match deployment name
---
# Platform - Self-Hosting - Release notes - v0.6.5
March 24, 2025
## Fixes
- Add lifecycle hooks to all Grafbase applications
---
# Platform - Self-Hosting - Release notes - v0.6.4
March 21, 2025
## Fixes
- use the same naming for postgresql/postgres
---
# Platform - Self-Hosting - Release notes - v0.6.3
March 19, 2025
## Fixes
- set runAsUser to 1001 (default grafbase user) for all containers
---
# Platform - Self-Hosting - Release notes - v0.6.2
March 11, 2025
## Dependency Updates
- Update external charts to latest
## Fixes
- Add PDBs to all Grafbase applications
---
# Platform - Self-Hosting - Release notes - v0.6.1
March 11, 2025
## Dependency Updates
- Update external charts to latest
## Fixes
- fix zitadel externalFullUri when `ExternalPort` is not set
---
# Platform - Self-Hosting - Release notes - v0.6.0
February 11, 2025
## Dependency Updates
- Fix api HPA configuration
- Update workloads to latest versions:
- api 0.3.1
- dashboard 0.3.0
- telemetry-sink 0.3.1
- clickhouse-migrations 0.3.1
---
# Platform - Self-Hosting - Release notes - v0.5.2
February 7, 2025
## Dependency Updates
- Update MinIO to v15.0.2
- Update ClickHouse to v8.0.0
- Update opentelemetry-collector to v0.116.0
---
# Platform - Self-Hosting - Release notes - v0.4.2
February 7, 2025
## Dependency Updates
- Update MinIO to v15.0.1
- Update Zitadel to v8.11.3
- Update Replicated to v1.1.0
---
# Platform - Self-Hosting - Release notes - v0.4.1
February 6, 2025
## Fixes
- Set API, dashboard, and telemetry sink charts to use the same version as the platform
- Simplify MinIO configuration for Kind deployments
- Add default resources for API, dashboard, and telemetry sink charts
## Dependency Updates
- Update Postgres to v16.4.6
- Update MinIO to v15.0.0
- Update Replicated to v1.0.0
- Update Kafka to 31.3.1
---
# Platform - Self-Hosting - Release notes - v0.4.0
January 31 2025
## Fixes
- Simplify Kafka configuration for Kind deployments
## Dependency Updates
- Update OpenTelemetry Collector to v0.115.0
- Update Kafka to v31.3.0
---
# Platform - Self-Hosting - Release notes - v0.3.0
January 23, 2025
## Dependency Updates
- Update OpenTelemetry Collector to v0.111.2
- Update MinIO to v14.10.5
- Update ClickHouse to v7.2.0
- Update Postgres to v16.4.5
- Update API to 0.2.0
- Update Dashboard to 0.2.0
- Update Telemetry Sink to 0.2.0
---
# Platform - Self-Hosting - Release notes - v0.2.1
January 20, 2025
## Fixes
- Use the official OpenTelemetry Collector chart
- Stop spamming OpenTelemetry Collector logs with unnecessary messages
- Disable unneeded ports from opentelemetry-collector
- Remove default values for `AWS_ACCESS_KEY_ID` and `AWS_SECRET_ACCESS_KEY` from the API configuration
---
# Platform - Self-Hosting - Release notes - v0.1.2
January 13, 2025
## Fixes
- Add `AWS_ACCESS_KEY_ID` and `AWS_SECRET_ACCESS_KEY` to the API configuration
- Enable dashboard by default
## Dependency Updates
- Update ClickHouse to v7.1.6
- Update Postgres to v16.4.3
- Update MinIO to v14.10.4
- Update Zitadel to v8.11.2
- Update Kafka to v31
- Update Telemetry Sink and API to tag 0.1.1
- Stop using latest tag for the dashboard
## Chores
- Add an icon to the helm chart
---
If you haven't installed the Grafbase CLI yet, see the [Installation section](/docs/cli/installation#installation).
## Interactive use
By default, the CLI will communicate with the API hosted at `https://grafbase.com`. To use the API in your self-hosted instance of the Enterprise Platform, you have to log in using the `--url` flag. Let's see how this works.
First, log out if you are already logged in:
```bash
grafbase logout
```
Then, find the URL of the dashboard (web UI) in your self hosted instance. For example, if you have a local instance created using the [guide](/guides/installing-grafbase-enterprise-platform), it will be `http://localhost:30081`. The command will look like this:
```bash
grafbase login --url http://localhost:30081
```
Log in interactively in the browser tab that the CLI opens, and the CLI is configured. Your credentials and the proper url for your own installation of the API are stored in `$HOME/.grafbase`.
## In scripts and CI
If you are using the CLI in non-interactive contexts, you will need to set the `GRAFBASE_ACCESS_TOKEN` environment variable with a valid access token, and the `GRAFBASE_API_URL` environment variable with the URL the GraphQL endpoint of your hosted instance of the API. For example, if you host the API at `https://grafbase-ep.mydomain.org`, the environment variable should be set to `https://grafbase-ep.mydomain.org/graphql`.
---
---
# CLI - Installation
The Grafbase CLI is the command line tool that allows you to interact with the Grafbase platform. It is a powerful tool that allows you to perform operations to your federated graph, trusted documents, and more. To install the Grafbase CLI, run the following command:
```bash
curl -fsSL https://grafbase.com/downloads/cli | bash
```
or, to install a specific version:
```bash
curl -fsSL https://grafbase.com/downloads/cli | bash -s 0.86.1
```
Alternatively, you can install the Grafbase CLI using NPM:
```bash
npm install grafbase
```
Or, in GitHub Actions, with the [install-grafbase-cli action](https://github.com/grafbase/install-grafbase-cli):
```yaml
- name: Install the Grafbase CLI
uses: grafbase/install-grafbase-cli@v1
```
---
# CLI - Commands - Branch
Commands that let you manipulate graph branches.
## Create a New Branch
Creates a new branch for a graph.
**Usage:**
```bash
grafbase branch create
```
**Arguments:**
- ``: Branch reference that uses the format `account/graph@branch`.
## Remove a Branch
Removes a branch from a graph.
**Usage:**
```bash
grafbase branch remove
```
**Arguments:**
- ``: Branch reference that uses the format `account/graph@branch`.
## Examples
Create a new branch for a graph:
```bash
grafbase branch create staging
```
Remove a branch from a graph:
```bash
grafbase branch remove staging
```
---
# CLI - Commands - Check
Checks a graph to locate validation, composition, and breaking change errors.
**Usage:**
```bash
grafbase check [OPTIONS] --name
```
**Arguments:**
- ``: Graph reference that uses the format `organization/graph@branch`.
**Options:**
- `--name `: Subgraph name to check.
- `--schema `: Path to the schema file to check. If this is not provided, the schema will be read from standard input.
## Examples
Check a subgraph schema file:
```bash
grafbase check --name my-subgraph --schema my-subgraph.graphql my-org/my-graph@main
```
Check a subgraph schema from standard input:
```bash
grafbase introspect http://localhost:4000/graphql | grafbase check --name my-subgraph my-org/my-graph@main
```
---
# CLI - Commands - Completions
Grafbase generates shell completion scripts for various shells. Put the file in your shell's location.
**Usage:**
```bash
grafbase completions
```
**Arguments:**
- ``: The shell to generate the completion script for. Either `bash`, `elvish`, `fish`, `powershell`, or `zsh`.
## Examples
Generate a bash completion script:
```bash
./grafbase completions bash >> ~/.bashrc
```
Generate a fish completion script:
```bash
./grafbase completions fish >> ~/.config/fish/completions/grafbase.fish
echo "source ~/.config/fish/completions/grafbase.fish" > ~/.config/fish/conf.d/grafbase.fish
```
Generate an elvish completion script:
```bash
grafbase completions elvish > ~/.elvish/lib/grafbase-completions.elv
echo "use grafbase-completions" >> ~/.elvish/rc.elv
```
Generate a zsh completion script:
```bash
grafbase completions zs >> ~/.zshrc
```
Generate a PowerShell completion script:
```bash
grafbase completions powershell >> $PROFILE.CurrentUserAllHosts
```
---
# CLI - Commands - Compose
Compose a federated schema from your subgraphs and print the resulting schema to stdout.
**Usage:**
```bash
grafbase compose [OPTIONS]
```
**Options:**
- `-c, --config `: The path of the configuration file. Defaults to `grafbase.toml`.
- `-g, --graph-ref `: Graph reference following the format `org/graph@branch`. It is optional, and only necessary if you want to include subgraphs from an existing graph.
## Examples
Compose a federated schema from a subgraph in the Grafbase platform:
```bash
grafbase compose --graph-ref my-org/my-graph@main
```
To override a subgraph, add the following to your configuration file:
```toml
[subgraphs.products]
introspection_url = "http://localhost:4000/graphql"
```
```bash
grafbase compose --graph-ref my-org/my-graph@main --config grafbase.toml
```
The compose command will gather all subgraphs from `my-org/my-graph@main` together with any local overrides, compose them into a federated schema, and print the result to stdout.
Note that the `--graph-ref` argument is optional. If you do not provide a graph ref, only the local subgraphs (defined in your configuration file) will be included.
To add introspection headers add the following to the configuration file:
```toml
[subgraphs.products.introspection_headers]
authorization = "Bearer {{ env.PRODUCTS_ACCESS_TOKEN }}"
```
To provide the schema path add the following to the configuration file:
```toml
[subgraphs.products]
schema_path = "/path/to/products.graphql"
```
You can redirect the output to a file:
```bash
grafbase compose --graph-ref my-org/my-graph@main > federated-schema.graphql
```
The compose command accepts a configuration file to customize the composition process:
```bash
grafbase compose --graph-ref my-org/my-graph@main --config grafbase.toml
```
Unlike the `dev` command, `compose` only generates the federated schema and does not start a server or UI.
---
# CLI - Commands - Create
Create a new graph.
**Usage:**
```bash
grafbase create [OPTIONS]
```
**Options:**
- `-n, --name `: Specify the graph name.
- `-a, --account `: Specify the account slug to create the graph.
## Examples
Create a new graph:
```bash
grafbase create --name my-graph --account my-org
```
---
# CLI - Commands - MCP
Start an MCP server for a given GraphQL API:
**Usage:**
```bash
grafbase mcp
```
**Options:**
- `-H, --header `: Add a header to the GraphQL requests
- `-s, --schema `: GraphQL schema to use instead of relying on introspection
- `-p, --port `: Port to listen on
- `--execute-mutations`: Grant this MCP server the ability to execute mutations
- `--transport`: Either `http-streaming` or `sse`. Defaults to `http-streaming`.
---
# CLI - Commands - Dev
Start the Grafbase local development environment.
**Usage:**
```bash
grafbase dev [OPTIONS]
```
**Options:**
- `-c, --config `: The path of the configuration file. Defaults to `grafbase.toml`.
- `-g, --graph-ref `: Graph reference following the format `org/graph@branch`. It is optional, and only necessary if you want to include subgraphs from an existing graph.
- `-p, --port `: The port to listen on.
## Examples
Start the local dev environment with a graph from the Grafbase Delivery Network:
```bash
grafbase dev --graph-ref my-org/my-graph@main
```
To override a subgraph, add the following to your configuration file:
```toml
[subgraphs.products]
introspection_url = "http://localhost:4000/graphql"
```
```bash
grafbase dev --graph-ref my-org/my-graph@main --config grafbase.toml
```
The dev command will start a server on `http://localhost:5000/graphql` and a Local UI on `http://localhost:5000/` to load in the browser. The command will load all the subgraphs from `my-org/my-graph@main` together with the local overrides, composing a federated schema.
All changes to the subgraph will be automatically registered to the federated schema. The server will also reload the schema when subgraphs change.
To add introspection headers add the following to the configuration file:
```toml
[subgraphs.products.introspection_headers]
authorization = "Bearer {{ env.PRODUCTS_ACCESS_TOKEN }}"
```
To provide the schema path add the following to the configuration file:
```toml
[subgraphs.products]
schema_path = "/path/to/products.graphql"
```
If port 5000 is not available, you can run the server on a different port:
```bash
grafbase dev --graph-ref my-org/my-graph@main --port 4000
```
The dev command accepts a configuration file to customize the server. In this example we define a [hooks](https://grafbase.com/docs/gateway/configuration/hooks) WebAssembly file to be loaded by the gateway:
```toml
[hooks]
location = "target/wasm32-wasip2/release/hooks.wasm"
```
Run the dev server with the custom configuration:
```bash
grafbase dev --graph-ref my-org/my-graph@main --config grafbase.toml
```
## MCP
You can enable the MCP server in the configuration file:
```toml
[mcp]
enabled = true
```
---
# CLI - Commands - Extension
Tools to create, manage, and deploy Grafbase extensions.
## Initialize a New Extension
Create a new Grafbase extension.
**Usage:**
```bash
grafbase extension init --type
```
- `--type`: Specify the type of extension to create. Either `auth` or `resolver`.
## Build an Extension
Build and package a Grafbase extension.
**Usage:**
```bash
grafbase extension build [OPTIONS]
```
- `--output`: Specify the output directory for the built extension. Defaults to `./build`.
- `--debug`: Build the extension in debug mode. Results in a larger and slower build output.
- `--source-dir`: Specify the source directory for the extension. Defaults to `.`.
- `--scratch-dir`: Specify the scratch directory for the extension. Defaults to `./target`.
---
# CLI - Commands - Introspect
Gets and displays the schema of a graph. Keep in mind that this command requires introspection to be enabled on the server.
**Usage:**
```bash
grafbase introspect [OPTIONS]
```
**Arguments:**
- ``: URL of the graph to introspect.
**Options:**
- `-H, --header [...]`: HTTP header to include in the introspection request.
- `--no-color`: Disable color output.
## Examples
Introspect a graph:
```bash
grafbase introspect http://localhost:4000/graphql
```
Introspect a graph with a custom header:
```bash
grafbase introspect --header "Authorization: Bearer asdf" http://localhost:4000/graphql
```
---
# CLI - Commands - Lint
Lints a GraphQL schema.
**Usage:**
```bash
grafbase lint [SCHEMA]
```
**Arguments:**
- `[SCHEMA]`: Path to the schema file to lint.
## Examples
Lint a schema file:
```bash
grafbase lint my-schema.graphql
```
Lint a schema from standard input:
```bash
grafbase introspect http://localhost:4000/graphql | grafbase lint
```
---
# CLI - Commands - Login
Log in to your Grafbase account.
**Usage:**
```bash
grafbase login
```
## Examples
Log in to your Grafbase account:
```bash
grafbase login
```
This command will open a browser window where you can log in to your Grafbase account. After logging in, you will be redirected back to the CLI.
---
# CLI - Commands - Logout
Logs out of your Grafbase account.
**Usage:**
```bash
grafbase logout
```
---
# CLI - Commands - Publish
Publishes a subgraph schema.
**Usage:**
```bash
grafbase publish [OPTIONS] --name --url
```
**Arguments:**
- ``: Graph reference that uses the format `account/graph@branch`.
**Options:**
- `--name `: Subgraph name to publish.
- `--schema `: Path to the schema file to publish. If this is not provided, the schema will be read from standard input.
- `--url `: The URL to the GraphQL endpoint of the subgraph.
- `-m, --message `: Commit message for the schema change.
## Examples
Introspect a remote graph and publish the schema from standard input:
```bash
grafbase introspect http://localhost:4000/graphql \
| grafbase publish \
--name users \
--url http://localhost:4000/graphql \
--message "Adds name field to the User type" \
my-org/my-graph@main
```
Publish a schema file:
```bash
grafbase publish \
--name users \
--url http://localhost:4000/graphql \
--message "Adds name field to the User type" \
--schema users.graphql \
my-org/my-graph@main
```
---
# CLI - Commands - Schema
Fetch a schema from the Grafbase schema registry.
**Usage:**
```bash
grafbase schema [OPTIONS]
```
**Arguments:**
- ``: Graph reference that uses the format `org/graph@branch`.
**Options:**
- `--name `: Subgraph name to fetch. If not provided, the federated graph schema is fetched.
## Examples
Fetch the schema of a subgraph:
```bash
grafbase schema --name users my-org/my-graph@main
```
Fetch the schema of a federated graph:
```bash
grafbase schema my-org/my-graph@main
```
---
## Grafbase Subgraphs Command
List subgraphs of a graph.
**Usage:**
```bash
grafbase subgraphs
```
**Arguments:**
- ``: Graph reference that uses the format `account/graph@branch`.
## Examples
List subgraphs of a graph:
```bash
grafbase subgraphs my-org/my-graph@main
```
---
# CLI - Commands - Trust
Submit a trusted documents manifest to the platform for gateway document fetching.
**Usage:**
```bash
grafbase trust --manifest --client-name
```
**Arguments:**
- ``: Graph reference that uses the format `account/graph@branch`.
**Options:**
- `-m, --manifest `: Path to the trusted documents manifest file.
- `-c, --client-name `: Name of the client.
## Examples
Read more about [trusted documents](/docs/gateway/security/trusted-documents).
---
# Federation - Overview
The purpose of Federation is to create a single, unified graph from many subgraphs. Some form of this idea has been around for a long time under the name "schema stitching", but Federation goes further by letting the federated GraphQL APIs — called "subgraphs" — declaratively extend each other and share parts of their API surface, in a way that is seamless and transparent for consumers of the Federated graph.
## Composition
Composition is the process of combining the schemas of all the subgraphs in a federated graphs into a single federated schema. The subgraphs can evolve independently most of the time, but composition has rules on what is valid or not.
Composition happens in the schema registry whenever you [publish a subgraph](/docs/platform/schema-registry#publishing-a-subgraph) or run a [schema check](/docs/platform/schema-checks).
Without [subgraph directives](/docs/federation/graphql-directives), the following basic rules apply:
**Object types** can be defined in any number of subgraphs, but each of their fields can only be defined in a single subgraph (the same field cannot be defined in two subgraphs). That each field belongs to a single subgraph that is responsible for resolving it.
The same rule applies to **interfaces**.
When the same **input type** is present in multiple subgraphs, composition will reduce it to the fields that are defined in all subgraphs, and exclude any field that is defined in some subgraphs but not others. If any nonnullable field is excluded, that triggers a composition errors. The same rule applies to field arguments.
**Enums** are composed based on how they are used:
- For enums that are used only in input types and field arguments, composition will only preserve the values of the enum that are common between all subgraphs
- For enums that are used only as output field types, composition will preserve all values from all subgraphs
- Enums that are used both in input and output position must match exactly between subgraphs, else that will be a composition error.
Composition will accumulate and merge all members for each **union** across all subgraphs.
**Directives** are not preserved in the composed schema except for built-ins like `@deprecated`.
This set of rules is of course very limiting in how much subgraphs can evolve together and integrate into a coherent, unified API. Read the following section entities and the [subgraph directives](/docs/federation/graphql-directives) page to understand how subgraphs can be better integrated.
## Runtime
At runtime, a federated setup is made up of three components:
- The subgraphs. They are regular GraphQL APIs that can use federation directives to interact with composition
- The [schema registry](/docs/platform/schema-registry), responsible for storing and composing published subgraph schemas
- The gateway, that serves the Federated Graph based on the schema composed by the schema registry
In the context of Grafbase, the subgraphs will be your standalone graphs or regular GraphQL APIs hosted on Grafbase or somewhere else. The schema registry is part of the platform; you interact with it through the web dashboard and the Grafbase CLI. The [Grafbase Gateway](/docs/gateway/installation) is a GraphQL router and gateway you run in your own premises. The gateway either always fetches the composed schema from the schema registry or can be configured to load it from a local file.
## Entities
The most important mechanism for subgraphs to combine with each other.
An entity is defined as an object annotated with the [`@key` directive](/docs/federation/graphql-directives#key):
```graphql
type Product @key(fields: "id") {
id: String!
name: String!
createdAt: DateTime!
}
```
The fields in `@key` uniquely identify the object across subgraphs, similar to the primary key in a database. When you use a GraphQL library compatible with federation to define a subgraph, each object annotated with `@key` will require that you write an entity resolver that can retrieve the object based on that key. For example in Apollo Server:
```js
const resolvers = {
User: {
__resolveReference(object) {
return fetchUserById(object.id) // fetchUserById is a hypothetical function that retrieves a User by their ID
},
},
}
```
The gateway knows which subgraphs can resolve which fields on each entity, so for example, if you have a comments subgraph for a blog API with the following API:
```graphql
type BlogPost @key(fields: "id") {
id: ID!
comments: [Comment!]
}
```
and a search subgraph with the following:
```graphql
type BlogPost @key(fields: "id") {
id: ID!
}
type Query {
findBlogPosts(filters: Filters): [BlogPost!]
}
```
you can query the gateway with queries that bridge the subgraphs transparently:
```graphql
query {
findBlogPosts(filters: [...]) {
id
comments {
id
title
author { name }
text
}
}
}
```
---
# Federation - Directives
Composition works without intervention when independent subgraphs don't share types and fields. Composition does more than schema stitching: federation directives enable each subgraph to specify what it resolves and how it connects with other subgraphs in the federated graph. This lets the router expose a consistent whole that spans across subgraphs while requiring minimal coordination between teams.
## @authenticated
The Grafbase Gateway has deprecated embedded support for this directive. Please use the [Authenticated](/extensions/authenticated) extension instead.
```graphql
directive @authenticated on FIELD_DEFINITION | OBJECT | INTERFACE | SCALAR | ENUM
```
Restrict access to the annotated item to successfully authenticated users. For more granularity, use [@requiresScopes](#requiresscopes).
## @composeDirective
```graphql
directive @composeDirective(name: String!) repeatable on SCHEMA
```
By default, composition only passes some built-in (`@deprecated`) and federation directives (like `@inaccessible`) from subgraphs into the federated schema.
Use the `@composeDirective` directive to tell composition to keep instances of a specific directive in the final API schema of the Federated Graph.
## @external
```graphql
directive @external on FIELD_DEFINITION | OBJECT
```
When used on a field, `@external` indicates that the subgraph can't resolve the field even though it exists in the subgraph's schema. Use this directive only in combination with `@provides` and `@requires`.
When you apply `@external` to an object, it has the same effect as applying `@external` to each field in that object.
## @inaccessible
```graphql
directive @inaccessible on FIELD_DEFINITION | INTERFACE | OBJECT | UNION | ARGUMENT_DEFINITION | SCALAR | ENUM | ENUM_VALUE | INPUT_OBJECT | INPUT_FIELD_DEFINITION
```
The `@inaccessible` directive excludes marked schema elements from the composed API schema that the gateway exposes. When you mark an item as `@inaccessible` in any subgraph, the composition excludes it from the composed API, even when the same item appears without `@inaccessible` in other subgraphs.
### Example 1: Hiding Information
```graphql
type PersonalDetails @inaccessible {
age: Int
heightCm: Int
birday: Date
}
type User @key(fields: "id") @key(fields: "socialSecurityNumber") {
id: ID!
# socialSecurityNumber is a key to enable fetching users by
# social security number, but we do not want the field to be
# queryable.
socialSecurityNumber: String! @inaccessible
# This field must be marked as inaccessible because the field
# type is inaccessible.
details: PersonalDetails @inaccessible
}
```
### Example 2: Adding Fields to a Shareable Type
Let's say you share an RGB color type across multiple subgraphs. Because the type uses `@shareable`, all subgraphs must return all fields. When you add a new field to the type, start by adding it to one subgraph and publishing.
This causes a composition error because only one subgraph contains the new field. You might choose to publish updates to all subgraphs quickly, though your federated graph won't compose during the interim.
While this works, it doesn't scale well with many subgraphs across different teams. Instead, use `@inaccessible` for a better solution. Publish your first subgraph with the new field like this:
```graphql
type Color @shareable {
red: Int!
green: Int!
blue: Int!
opacity: Int! @inaccessible
}
```
The inaccessible `opacity` field won't trigger composition errors when other subgraphs don't define it. Add the field to other subgraphs one at a time. After all subgraphs include the field, remove `@inaccessible`. All intermediate states will compose cleanly.
## @interfaceObject
```graphql
directive @interfaceObject on OBJECT
```
Federation supports entity interfaces, which follow the same model as regular entities but have different definition requirements and interface-specific behaviors.
An interface entity must include:
- An interface with a key in one subgraph.
- A regular object entity using the `@interfaceObject` directive in other subgraphs.
Objects that implement an entity interface automatically receive fields that other subgraphs contribute to that entity. This matches how objects normally implement regular interfaces.
## @key
```graphql
directive @key(
fields: FieldSet!
resolvable: Boolean = true
) repeatable on OBJECT | INTERFACE
```
The `@key` directive defines entities in your schema. An entity is a type that includes a key and appears in multiple subgraphs. It acts as the main mechanism to connect subgraphs in Federation, similar to a primary key.
When you create an entity type with the `@key` directive, your [Federation compatible GraphQL framework of choice](https://www.apollographql.com/docs/federation/building-supergraphs/supported-subgraphs) requires you to define an _entity resolver_ for that type. This resolver works with the Federation-specific `Query._entities` field to fetch
**Arguments**:
- `fields`: A string that contains the GraphQL selection set for key fields. You can nest the selection (for example, `@key(fields: "a { b } c d")`), but field arguments aren't valid (for example, don't use `@key(fields: "id(type: UUID) { bytes }")`).
- `resolvable`: Set this value to false to show that a subgraph references an entity (often by returning its key) but can't resolve it through `Query._entities`. This means the subgraph doesn't have an entity resolver for that entity. Use this when a subgraph includes an entity key (like `author_id` on a blog post) but doesn't contribute fields to the entity.
### Example
This example uses a fictitious e-commerce website to show how entities work. Define the `inventory` subgraph first:
```graphql
type Product @key(fields: "id") @key(fields: "sku") {
id: ID!
itemsInStock: Int!
sku: String!
}
```
The second `@key` means the `inventory` subgraph resolves a `Product` by using its SKU.
Then a `reviews` subgraph for product reviews:
```graphql
type Product @key(fields: "id") {
id: ID!
reviews: [Review!]
}
```
The final `search` subgraph finds products based on a user's search query:
```graphql
type Query {
findProducts(searchQuery: String!): [Product!]
}
type Product @key(fields: "id") {
id: ID!
}
```
The federated graph's API looks like this after composition:
```graphql
type Query {
findProducts(searchQuery: String!): [Product!]
}
type Product {
id: ID!
reviews: [Review!]
itemsInStock: Int!
sku: String!
}
```
API clients see one `Product` type. Subgraphs contribute fields without requiring coordination.
## @override
```graphql
directive @override(from: String!, label: String) on FIELD_DEFINITION
```
Use the `@override` directive to migrate a field from one subgraph to another. To migrate a field to a new subgraph, first define it in the new subgraph. The rules of composition don't allow defining the same field in two subgraphs. If you define the field as `@shareable`, all subgraphs must resolve it, not just the source and destination. Marking the new field as `@inaccessible` doesn't help because you still can't switch the field between subgraphs without coordination and downtime.
The `@override` directive solves this problem. When you add `@override(from: "other-subgraph")` to a field, the gateway routes requests for that field to the subgraph with the override and ignores the field in `other-subgraph`. Teams can deploy changes independently using this workflow (each bullet point represents a `publish`):
- Deploy the new field with `@override` in the overriding subgraph. If the field doesn't work correctly in the new subgraph, reverse the change and the gateway will resume resolving the field in the original subgraph.
- Remove the old field from the overridden subgraph.
- Remove the `@override` directive from the overriding subgraph.
**Arguments**:
- `from`: Specify the name of the subgraph that contains the field you want to override. Composition doesn't validate this name to support this workflow: 1. Define the overriding field with `@override`, 2. Deploy, 3. Remove the overridden field, 4. Remove the `@override` on the new field. This avoids breaking the migration at step 3 when subgraphs publish independently.
- `label`: Controls partial or progressive overriding. Set the `label` argument to a string formatted as "percent(n)" where n is an integer from 0-100. This percentage determines how much traffic the gateway routes to the overriding subgraph. For example, `@override(from: "inventory", label: "percent(0)")` routes no traffic to the new subgraph, while `@override(from: "inventory", label: "percent(100)")` behaves the same as `@override(from: "inventory")` without the `label` argument.
### Example
Split the comments handling from your blog engine monolith into a dedicated service with its own subgraph. The monolith defines the `Post` type like this:
```graphql
type Post @key(fields: "id") {
id: ID!
title: String
comments: [Comment!]
publishedAt: DateTime
author: User
}
```
To migrate the `Post.comments` field to the new comments service, add the following to the comments subgraph's schema:
```graphql
type Post @key(fields: "id") {
id: ID!
comments: [Comment!] @override(from: "monolith")
}
```
After you deploy this addition, the gateway routes all traffic for `Post.comments` to the comments subgraph.
## @provides
```graphql
directive @provides(fields: FieldSet!) on FIELD_DEFINITION
```
The `@provides` directive on a field tells the gateway that when resolving this field, the same subgraph can also resolve a set of other fields on that object to optimize performance.
You must annotate these other fields with `@external`, since the subgraph can only resolve them when resolving the field with `@provides`. Think of this directive as a more restricted version of `@shareable`.
While shareable fields allow resolution at any time, fields marked with `@external` and provided with `@provides` only allow resolution when resolving their providing field.
### Example
The following shows a `Farm` subgraph:
```graphql {5}
type Farm @key(fields: "id") {
id: ID!
name: String!
location: String
vegetables: [Vegetable] @provides(fields: "name")
}
type Vegetable @key(fields: "id") {
id: ID!
name: String! @external
}
extend type Query {
farm(id: ID!): Farm
vegetablesInSeason(date: Date!): [Vegetable!]
}
```
Here's the `Vegetable` subgraph:
```graphql
type Vegetable @key(fields: "id") {
id: ID!
name: String!
scientificName: String!
nutritionInfo: NutritionInfo
marketPriceEur: Int
}
```
Consider these two queries that demonstrate how `@provides` works.
```graphql
query {
farm(id: "6058691a-2d0a-47f1-95b3-1632f9ad16f9") {
id
name
}
}
```
The `Query.farm` field provides `name`, so the `Farm` subgraph can resolve the whole query without contacting other subgraphs. However, in this second query:
```graphql
query {
vegetablesInSeason(date: "2023-10-03") {
id
name
}
}
```
The gateway must fetch the vegetable name from the `Vegetables` subgraph. API consumers see one unified Vegetable type that includes all fields defined across all subgraphs.
## @requires
```graphql
directive @requires(fields: FieldSet!) on FIELD_DEFINITION
```
The `@requires` directive specifies when a field needs other fields from the parent type that other subgraphs can resolve. Here's an example: Consider a hotel booking subgraph that manages room service. This subgraph determines available room service based on a hotel's location and category, but doesn't store hotel information directly in its database.
### Example
The Hotels subgraph:
```graphql
type Hotel @key(fields: "id") {
id: ID!
category: Int
countryCode: String
}
```
The RoomService subgraph:
```graphql
type Hotel @key(fields: "id") {
id: ID!
category: Int @external
countryCode: String @external
roomServiceOffering: [String!]! @requires(fields: "category countryCode")
}
```
In this last snippet, the RoomService subgraph resolves `Hotel.roomServiceOffering` but requires the `category` and `countryCode` fields from another subgraph. The `@requires` directive indicates dependencies on `category` and `countryCode` fields, while `@external` shows the subgraph can't resolve them directly. You must define the required fields on the type and annotate them with `@external`.
When resolving a query that selects `Hotel.roomServiceOffering`, the gateway queries the Hotels subgraph first before passing data to the RoomService subgraph to resolve `roomServiceOffering` for that hotel. The gateway passes the retrieved fields to the entity resolver (`Query._entities`) on the RoomService subgraph.
Other subgraphs can resolve fields marked with `@external`. Zero subgraphs make the field with `@requires` impossible to query, one subgraph works for regular entity fields, and multiple subgraphs work with `@shareable` fields.
Use `@requires` only on entity fields and always combine it with [`@external`](#external).
## @requiresScopes
The Grafbase Gateway has deprecated embedded support for this directive. Please use the [Requires Scopes](/extensions/requires-scopes) extension instead.
```graphql
directive @requiresScopes(
scopes: [[String!]!]!
) on FIELD_DEFINITION | OBJECT | INTERFACE | SCALAR | ENUM
```
Users must have a matching `scope` claim in their JWT access token to access the annotated item. Format the `scope` claim as a space-separated string of scope names.
The directive's `scopes` argument contains an array of arrays that defines combinations of scopes. Each inner array specifies a set of required scopes (AND logic). The outer array lists alternative scope combinations that can grant access (OR logic). You can list scopes in any order.
### Example
Let's restrict blog post view count access to users with both `editor` and `analytics` scopes, or users with admin scope:
```graphql {5,5}
type BlogPost {
id: ID!
title: String!
author: User
viewCount: Int @requiresScopes(scopes: [["admin"], ["editor", "analytics"]])
content: String
}
```
## @shareable
```graphql
directive @shareable on FIELD_DEFINITION | OBJECT
```
Use this directive to share a type or field between subgraphs. In contrast to entities that use `@key`, all subgraphs must resolve shareable types and fields. A Color type demonstrates this pattern:
```graphql
type Color @shareable {
red: Int!
green: Int!
blue: Int!
}
```
Each subgraph that returns a `Color` must provide all fields. Think of shareable types as value types that provide complete data.
When you annotate a type like `Color` with `@shareable`, it affects all fields of that type as if you added `@shareable` to each field individually.