Combine schema proposals with operation checks for fine-grained breaking change management
Track and analyze organization activity with comprehensive audit logging
Introducing native OpenID Connect based Single Sign-On support in Grafbase Enterprise Platform for seamless authentication across your organization.
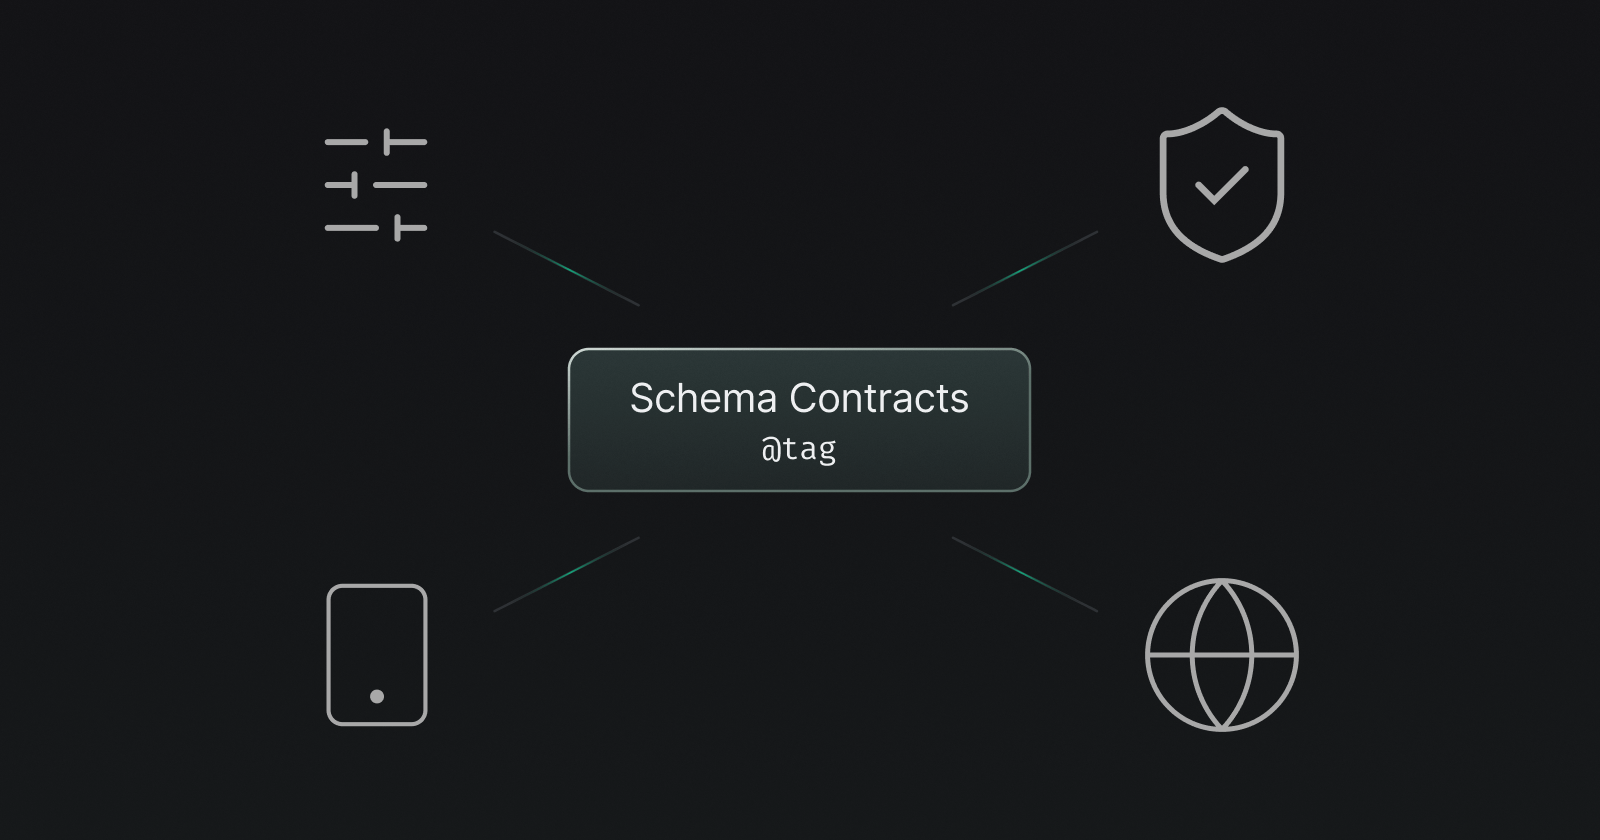
Define and enforce specific schema subsets for enhanced security and control
Interact with the Grafbase API from any MCP-enabled AI application with the Grafbase Remote MCP. Built with the same Gateway built-in MCP you can use for your own GraphQL API.
Introducing full OAuth support in the MCP server, enabling secure authentication and authorization for your applications.
Integrate Apache Kafka directly into your federated GraphQL API with zero infrastructure management - no subgraphs, no manual stitching, and no extra services required.
Integrate PostgreSQL databases directly into your federated GraphQL API with zero infrastructure management - no subgraphs, no manual stitching, and no extra services required.
Compose your subgraphs into a federated GraphQL schema locally
Integrate gRPC services into your federated graphs without coding.
We’re excited to announce support for Model Context Protocol, marking a major step forward in how developers and AI agents interact with GraphQL APIs.
Add your own business logic to Schema Checks